Operations | Monitoring | ITSM | DevOps | Cloud

Monitoring

The latest News and Information on Monitoring for Websites, Applications, APIs, Infrastructure, and other technologies.

Symfony Performance Improvements: Tips and Techniques

Perhaps you came upon this post while looking at ways to improve Symfony performance. Or maybe you read our comparison of Laravel and Symfony and want to know more. You could have gotten here because you want to write a performant app from the start. Then again, you could just love reading all of Stackify’s blog posts. And who could blame you? However you got to this post, or whatever goals you may have, I’m here to talk to you about Symfony performance tuning.

Key Insights From Forrester Research on Containers and Microservices

In our previous post about containers and microservices, we covered the challenges of monitoring these new technologies as well as how you can use software-defined IT operations tools to overcome them. The recently released Forrester Research report, Monitoring Containerized Microservices?

JMX monitoring + Java custom metrics.

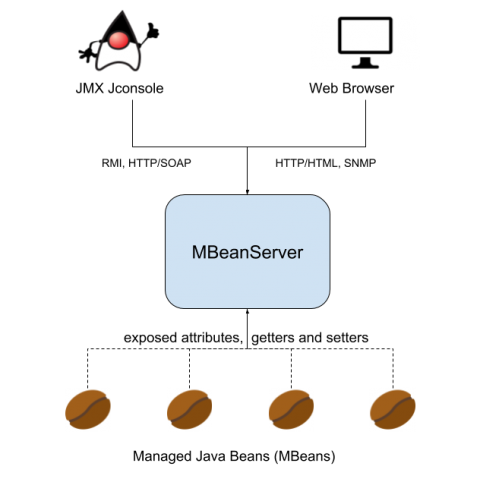
In this tutorial we are going to learn how to instrument Java code to expose application metrics using JMX monitoring. Following the code examples, you can monitor the availability, health and performance of your Java application. Java 1.5 introduced JMX – Java Management eXtensions – which is a standard way to instrument code in the JRE world.

The Trade Desk: Lessons We Learned Migrating from Homegrown Monitoring to Prometheus

The Trade Desk provides a self-service, cloud-based platform for buyers of online advertising. Since its founding in 2009, TTD has grown into a publicly traded company with more than 900 employees and a market cap of $8.89 billion. The company recently moved from an old monitoring system based on Nagios, Graphite, and a number of homegrown pieces of software, to something more standard, based on Prometheus.

Splunk Cloud vs. Loggly: 2019 Speed Test

The core ability to search through logs quickly and intuitively is the most important feature a log management system brings to the table. Being able to quickly and efficiently search through logs generated by an infrastructure stack allows DevOps professionals to rapidly find and address problems, as well as confirm deployments and configuration changes. Because raw speed has such a direct impact on the usefulness of these products, we will compare to see which performs the best.

451 Research and IDC Call Out OpsRamp's Innovations for Service-Centric AIOps and Hybrid Cloud Management

The second quarter of 2019 started with a bang for OpsRamp, with recognition from two independent analyst firms, 451 Research and IDC. Three recent analyst reports highlighted OpsRamp’s modern digital and IT operations management platform for dynamic performance insights and maximum visibility.

From SRE to QE - Full Visibility for the Modern Application in both Production and Development

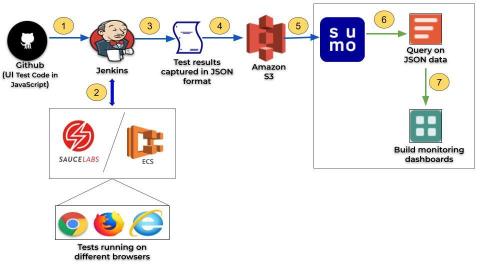
Site reliability engineers (SREs) rely on monitoring and analytics tools like Sumo Logic to guarantee uptime and performance of their applications and various components or services in production. The ability to visually monitor, automatically generate alerts and efficiently troubleshoot an issue in real time has become table stakes for any modern SRE team.