Operations | Monitoring | ITSM | DevOps | Cloud
The latest News and Information on IT Networks and related technologies.
The Insider's Guide to Network Connectivity Monitoring: Keeping Your Connections Strong
The 7 Step Guide on How To Budget for Layer 2 and Layer 3 Switches
Best 30 Enterprise Network Monitoring Software of 2023
SNMP Monitoring: What is SNMP & How to Use It
Are you tired of constantly running back and forth to check the status of your network devices? Do you wish you had a magic wand that could tell you everything you need to know about your network at a glance? Well, unfortunately, we can't give you a magic wand, but we can give you something pretty close: SNMP monitoring!
Enhanced Security, Improved Performance Reporting with DX UIM 20.4 Cumulative Update 7
In today's fast-paced digital world, keeping up with the latest technology advancements is crucial for businesses to stay ahead of the competition. This is especially true in the world of IT infrastructure management, where technology is rapidly evolving and new solutions are being developed to meet the changing needs of businesses.
Q&A: How the DoD Can Modernize Its Networks and Optimize User Experience
The Department of Defense (DoD) is on a mission to modernize its IT environments, radically changing the nature of its network operations (NetOps) in the department. Network availability and performance keep getting more integral to the DoD’s charter, which means downtime isn’t just troublesome, it’s a life-or-death matter. In this post, we’ll outline how key DoD modernization imperatives are affecting NetOps.
The Art of Proactive Network Monitoring: Stay Ahead of the Game
Imagine you're playing a game of chess, but instead of reacting to your opponent's moves, you can see five moves ahead and plan your strategy accordingly. That's the power of proactive network monitoring. Instead of waiting for issues to arise and reacting to them, you can stay several steps ahead and keep your network running smoothly. In this post, we'll explore the art of proactive network monitoring and how it can help you stay ahead of the game.
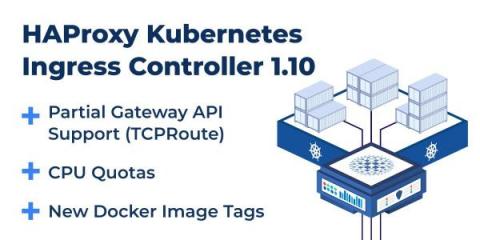
Announcing HAProxy Kubernetes Ingress Controller 1.10
HAProxy Kubernetes Ingress Controller 1.10 is now available. HAProxy Enterprise Kubernetes Ingress Controller 1.10 is coming soon, and will incorporate these same features.In this release, we added partial support for Gateway API, added new Docker image tags to Docker Hub to make it easier to pull the latest version, and implemented other minor improvements. HAProxy Kubernetes Ingress Controller 1.10 is built with HAProxy version 2.7.We discuss the changes in this version below.


