The latest News and Information on Observabilty for complex systems and related technologies.
Just when you thought everything that could be shifted left has been shifted left, we’re sorry to say you’ve missed something: observability. Modern software development—where code is shipped fast and fixed quickly—simply can’t happen without building observability in before deployments happen. Teams need to see inside the code and CI/CD pipelines before anything ships, because finding problems early makes them easier to fix.
Across industries and geographies, businesses rely heavily on Systems Applications and Products (SAP) systems. These powerful and versatile systems streamline operations and manage critical data spanning areas like finance, human resources, and supply chain. However, the real-time monitoring of these systems, with an in-depth understanding of performance metrics and quick anomaly detection, is paramount for smooth operations and business continuity. It's here that our unique offering steps in.
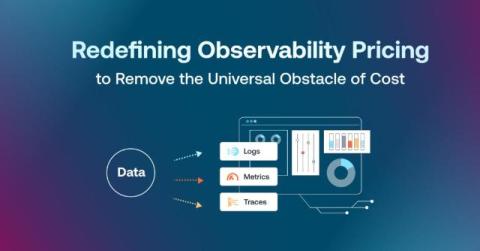
Understanding Metrics, Logs, Events and Traces - the key pillars of observability and their pros and cons for SRE and DevOps teams.
Observability of an SAP environment is critical. Whether you have a large complex and hybrid environment or a small set of simply architected systems, the importance of these systems is probably crucial to your business. Just thinking about system outages keeps us up at night, let alone the pressure of system performance, cross system communication and proper backend processing.
As more organizations leverage the Amazon Web Services (AWS) cloud platform and services to drive operational efficiency and bring products to market, managing logs becomes a critical component of maintaining visibility and safeguarding multi-account AWS environments. Traditionally, logs are stored in Amazon Simple Storage Service (Amazon S3) and then shipped to an external monitoring and analysis solution for further processing.
Datadog and Splunk are among the most popular performance monitoring tools available on the market. If you’re looking for such a solution and looking to scratch one off your shortlist, look no further than this article. In this Datadog vs Splunk comparison, we will take a deep dive into everything each tool has to offer. We will point out their similarities and differences to help you decide which tool can meet your needs better.
Honeycomb recently released our Query Assistant, which uses ChatGPT behind the scenes to build queries based on your natural language question. It's pretty cool. While developing this feature, our team (including Tanya Romankova and Craig Atkinson) built tracing in from the start, and used it to get the feature working smoothly. Here's an example. This trace shows a Query Assistant call that took 14 seconds. Is ChatGPT that slow? Our traces can tell us!
“Observability” seems to be the buzzword du jour in IT these days but what does it actually mean, and how is it any different from plain, old monitoring? In simple terms, observability is the ability to understand how a system is performing and how it is behaving from the data that system generates. It is not just about monitoring metrics or collecting logs, but also understanding the context of those metrics and logs, and how they relate to the overall health of the system.