The latest News and Information on Observabilty for complex systems and related technologies.
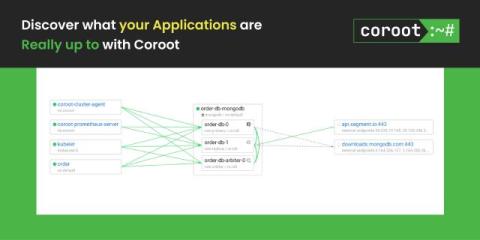
Businesses are increasingly adopting distributed microservices to build and deploy applications. Microservices directly streamline the production time from development to deployment; thus, businesses can scale faster. However, with the increasing complexity of distributed services comes visual opacity of your systems across the company. In other words, the more complex your system gets, the harder it becomes to visualize how it works and how individual resources are allocated.
Developers are increasingly drawn to Functions-as-a-Service (FaaS) offerings provided by major cloud providers such as AWS Lambda, Azure Functions, and GCP Cloud Functions. The Cloud Native Computing Foundation (CNCF) has estimated that more than four million developers utilized FaaS offerings in 2020. Datadog has reported that over half of its customers have integrated FaaS products in cloud environments, indicating the growth and maturity of this ecosystem.
So you're used to debugging systems using a distributed trace, but your system is about to introduce a message queue—and that will work the same… right? Unfortunately, in a lot of implementations, this isn't the case. In this post, we'll talk about trace propagation (manual and OpenTelemetry), W3C tracing, and also where a trace might start and finish.
The world of software is growing more complex, and simultaneously changing faster than ever before. The simple monolithic applications of recent memory are being replaced by horizontal cloud-native applications. It is no surprise that such applications are more complex and can break into infinitely more ways (and ever new ways). They also generate a lot more data to keep track of. The pressure to move fast means software release cycles have shrunk drastically from months to hours, with constant change being the new normal.
Distributed tracing enables you to monitor and observe requests as they flow through your distributed systems to understand whether these requests are behaving properly. You can compare tiny differences between multiple traces coming through your microservices-based applications every day to pinpoint areas that are affecting performance. As a result, debugging and troubleshooting are simpler and faster.
As organizations are adopting more of the FinOps foundation practices and trying to optimize their cloud-computing costs, engineering plays an imperative role in that maturity. Traditional troubleshooting of applications nowadays relies heavily on static logs and legacy telemetry that developers added either when first writing their applications, or whenever they run a troubleshooting session where they lack telemetry and need to add more logs in an ad-hoc fashion.