Operations | Monitoring | ITSM | DevOps | Cloud
The latest News and Information on Observabilty for complex systems and related technologies.
The Five Myths of Observability
Observability is a term that has gained a lot of traction in recent years, particularly in the realm of software engineering and DevOps. At its core, observability refers to the ability to gain insight into the internal workings of a system by observing its external outputs. This allows engineers to diagnose and troubleshoot issues with the system, as well as to monitor its performance and behaviour.
How can observability cultivate collaboration among engineering teams?
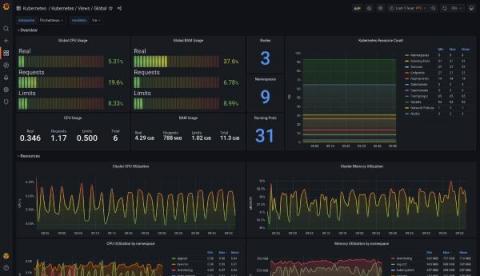
How to monitor Kubernetes with Grafana and Prometheus: Inside Powder's observability stack
David Calvert is a site reliability engineer working remotely from the south of France. He’s currently focused on observability, reliability, and security aspects of cloud infrastructure. You can find him as dotdc on GitHub and @0xDC_ on Twitter. Over the past three years, I’ve built and operated Kubernetes clusters for two different companies — the first one on-premises, and the second on a public cloud platform for my current job at Powder.
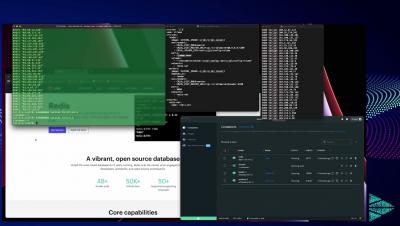
How to Deploy a Cribl Stream Leader, Cribl Stream Worker, and Redis Containers via Docker
Security Observability Trends for 2023
Bifurcating Observability Data To Multiple Destinations
Are you just getting started with Cribl Stream? Or maybe you’re well on your way to becoming a certified admin through our Cribl Certified Observability Engineer certification offered by Cribl University. Regardless, using Cribl Stream to send data from one source to many destinations is something you’ll want to try. So if you’re ready, read on!
Author's Cut-A Sample of Sampling, and a Whole Lot of Observability at Scale
Brick by brick, block by block—if you’ve been with us throughout our Author’s Cut blog series (and if you haven’t, you can go catch up), you’ve seen us build the case for observability from the ground up. We’ve covered structured events, the core analysis loop, and use cases for managing applications in production—and that’s just to start.
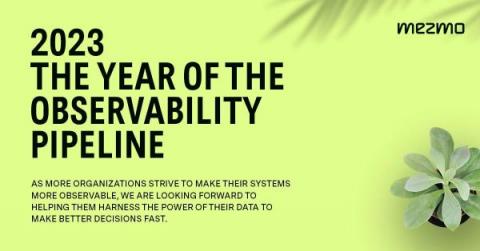
The Year of the Observability Pipeline
As we begin the new year, it is customary to reflect and identify areas we can continue to grow in 2023. Whether it’s joining the local gym, starting a new diet, or taking up a new hobby, this time is always full of promise to continually improve. The same can be said for digital businesses of every size and across every vertical. Macroeconomic trends have especially made this time one of reflection for a number of organizations.
The Reality of Machine Learning in Network Observability
For the last few years, the entire networking industry has focused on analytics and mining more and more information out of the network. This makes sense because of all the changes in networking over the last decade. Changes like network overlays, public cloud, applications delivered as a service, and containers mean we need to pay attention to much more diverse information out there.


