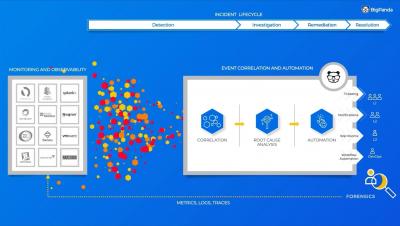
Operations | Monitoring | ITSM | DevOps | Cloud

The latest News and Information on Observabilty for complex systems and related technologies.

HAProxy Log Sampling

Log Sampling is a powerful feature introduced in HAProxy 2.0 that lets you define a percentage of your logs to create a representative view of your data allowing you to minimize your costs. Log files are the key to observability. They can provide helpful information that can be used for debugging as well as analytics that can be used to understand how users interact with an application.

Achieve Better Observability into AWS Services with the AWS CloudWatch Monitoring Template

Amazon CloudWatch — Amazon’s built-in infrastructure monitoring tool — monitors your Amazon Web Services (AWS) resources and the applications you run on AWS in real time. Here’s what you can do with this tool and how to access AWS CloudWatch monitoring dashboards.

The observability market is heating up, but is it more than just hype? Industry watchers weigh in

The observability market is undoubtedly hot. Consider the headline-grabbing evidence: multiple IPOs, hundreds of millions of dollars in venture capital funding for startups, and huge market caps of vendors playing in the space totalling more than $80 billion. Still, it has to be asked: Is all the hype warranted, or is this really just “absurdability”? We asked seven industry watchers to weigh in.

Announcing Honeycomb's extension for the AWS Lambda Runtime Logs API

Today, AWS announced the AWS Lambda Runtime Logs API, a new way to easily send logs from AWS Lambda functions directly to your destination of choice. AWS Lambda Extensions, announced in October, provide the ability to run code in parallel that is independent of your function’s lifecycle. We’ve created an extension that utilizes the Lambda Runtime Logs API to send your logs directly to Honeycomb.

Measure Customer Value with Self-Service Observability

DevOps practices, and the teams that implement them, are becoming increasingly critical to the value which any company provides its customers. This was the key message throughout a recent fireside chat between DevOps Institute Chief Ambassador Helen Beal and Moogsoft VP of Product and Design Adam Frank. A great paradox of the digital era is that, once written, software is invisible to those who write it.

An Introduction to our New Product: Logz.io Distributed Tracing

Yesterday we were excited to announce Logz.io Distributed Tracing, the most recent addition to our Cloud-Native Observability Platform. This is such a special launch for us because it makes Logz.io the only place where engineers can use the best open source monitoring tools for logs, metrics, and traces – known as the ‘three pillars’ to observability – together in one place.

User Experience Monitoring and Synthetics with Elastic Observability

Elastic Observability 7.10 introduces exciting new capabilities that bring deeper visibility into the most important layer of digital monitoring — the experience of the end user. User experience monitoring — accessed via a brand new app in Kibana — provides real-time visibility into website performance, and multistep journey checks in Uptime significantly expand synthetic monitoring capabilities to help operational teams proactively catch issues by monitoring simulated journeys. Plus, several new features like searchable snapshots, out-of-the-box anomaly detection jobs for infrastructure monitoring, and a PHP agent for Elastic APM help the Elastic Observability community optimize costs while deepening visibility across operations.

Observability with Context: Telemetry, Time, Tracing, and Topology

That’s the question ops personnel have been asking for decades whenever something goes wrong in the production IT environment. Everything was working before, so the reasoning goes, and now it’s not. We have an incident. And to figure out what caused the incident – and hence, to have any idea how to fix it – we must know what changed. There’s just one problem with this approach. What if everything is subject to change, all the time?

ScaleUP 2020 Recap: Introducing Distributed Tracing & More

Today was a monumental day for Logz.io and our entire community. There is nothing more inspiring than seeing how people use the technology we’ve built to enhance their businesses. At ScaleUP 2020, our first ever global user conference, we hosted an exciting day of technical, customer-led sessions with our community. We also had the privilege of unveiling some ground-breaking new solutions and enhancements to our end-to-end cloud-native observability platform.