Operations | Monitoring | ITSM | DevOps | Cloud

February 2025

Stronger together: (Agentic) AIOps and observability are the keys to IT resilience

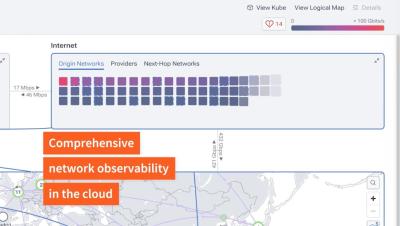
Every new layer of infrastructure piles onto an already fragile web of interconnected challenges, making it painfully clear: traditional monitoring can’t keep up. You’re drowning in alerts, buried in data, and yet somehow still flying blind when real issues arise. More notifications don’t mean more insight, and more data doesn’t guarantee better decisions.

Wiring Up a Next.js Self-Hosted Application to Honeycomb

Are you attempting to connect Honeycomb to a standalone (not hosted with Vercel) Next.js application? Most of the Next.js OpenTelemetry samples in the wild show how to connect Next.js to Vercel’s observability solution when hosting on their platform. But what if you’re hosting your own standalone Next.js server on Node.js? This blog post will get you started ingesting your Next.js application’s telemetry into Honeycomb.

Preempting Problems in a Sociotechnical System

Here at Honeycomb, we emphasize that organizations are sociotechnical systems. At a high level, that means that “wet-brained” people and the stuff they do is irreducible to “dry-brained” computations. That cashes out as the inability to ultimately remove or replace people in organizations with computers, in spite of what artificial general intelligence (AGI) ideologues would have you believe.

The ROI of Developer-First Observability: Why It's a Game Changer

In today’s fast-paced software landscape, downtime is costly, debugging is time-consuming, and developers are constantly under pressure to resolve issues quickly. Observability tools have traditionally been built for operations and SRE teams, focusing on post-mortem analysis rather than proactive debugging. When developers gain real-time insights into live applications and fix issues without disrupting the software lifecycle it has been proven to be a game changer for a myriad of reasons.

The Hard Truth About the Observability Landscape

Why are ex-FAANG engineers building observability companies? When millions depend on reliable software, a simple reboot isn't enough anymore. From The Incidentally Reliable podcast with Piyush Verma discussing modern software reliability.#Observability Exclusively on The Incidentally Reliable podcast, which is made by SREs for SREs and hosted by Zenduty. Zenduty is a revolutionary incident management platform that gives you greater control and automation over the incident management lifecycle.

Understanding the Observability Data Lifecycle: From Data Ingestion to Automated Actions

Modern IT estates are increasingly complex, generating vast amounts of data – some critical and actionable, but much of it mere noise. Extracting meaningful insights to ensure optimal system health and IT performance is beyond the scope of humans. This is where observability, enhanced by AI and automation, becomes essential.

Right Data, Right Now: Why Timely, Actionable Network Observability is Essential

For teams in many organizations, the work of IT and network management keeps getting more difficult. A recent EMA survey offers some findings that clearly illustrate this point. When respondents were asked which networking skills are the most difficult to find, several roles received a response of 30% or more, including network security, network monitoring and troubleshooting, and data center networking.

Datadog Vs. New Relic: Comparing Observability Tools In 2025

Datadog and New Relic didn’t become some of the best observability platforms today by accident. Unlike traditional monitoring tools, both are built from the ground up to be cloud-native. This design is crucial for tracking system health across hybrid cloud infrastructure, modern applications, and microservices/containerized architectures. Both platforms also offer more flexible pricing models than the traditional subscription-based pricing you’ll see elsewhere.

Stop Logging the Request Body!

With more and more people adopting OpenTelemetry and specifically using the tracing signal, I’ve seen an uptick in people wanting to add the entire request and response body as an attribute. This isn’t ideal, as it wasn’t when people were logging the body as text logs. In this blog post, I’ll explain why this is a bad idea, what are the pitfalls, and more importantly, what you should do instead.

From Datadog to Grafana Cloud: Why companies migrate and how it changes business for the better

“Impossibly expensive.”“Generic database metrics.”“Exceeding limits.”“No transparency.” These are the words our customers use to explain why they looked for a Datadog alternative and migrated onto Grafana Labs’ observability solutions. Grafana Cloud provided the scalability that LexisNexis Risk Solutions needed to migrate acquired companies into a unified observability platform. “We’ve had migrations from Datadog.

Ensuring Optimal Kubernetes Cluster Health with Calico Observability

Have you ever wondered how to navigate the complexities of managing Kubernetes clusters effectively? Observability is the key, and Elasticsearch plays a pivotal role in storing and analyzing the critical data that keeps your systems running smoothly.

Coralogix Releases eBPF Observability for K8s Workloads

There are several big barriers to an effective tracing strategy. Modern applications require complex code instrumentation, and legacy applications might not be so easy to alter, and that’s assuming every engineering team can be engaged to make the necessary changes. eBPF & OpenTelemetry flip this entire problem on its head, and Coralogix is one of the first major observability platforms to leverage this exciting functionality, to provide an unobtrusive, low risk overview of your system.

How Azure Observability Optimizes Performance and Monitoring

Observability in Azure isn’t just about tracking metrics—it’s about truly understanding how your cloud infrastructure, applications, and services are performing. It helps you spot issues before they become problems, optimize performance, and ensure security. In this guide, we’ll break down Azure Observability in a way that’s easy to follow, covering key concepts, best practices, and some useful tricks to give you an edge.

Frontend Monitoring: Deliver Seamless and Performant User Experiences

88% of online consumers are less likely to return to a site after a bad user experience. This means that addressing frontend issues such as slow load times, broken features, and unresponsive elements is crucial. Frontend monitoring helps development and IT teams proactively catch and resolve these issues to improve their user experience.

Why observability needs FinOps, and vice versa: the Vantage integration with Grafana Cloud

Ben Schaechter is co-founder & CEO of Vantage, a cloud cost management platform that provides actionable insights for every engineer. Observability tools have changed the way we monitor infrastructure and applications, as teams get complete visibility into performance across complex, multi-cloud environments. But as all that infrastructure scales, costs rise with it, and organizations are left to ask: Where are my costs going—and why?

Beyond monitoring: The power of observability

The demand for seamless user experiences and robust system reliability is at an all-time high, and businesses are racing to meet these expectations. But as system complexity increases, traditional monitoring tools are falling short. Observability offers a paradigm shift. It goes beyond tracking metrics and provides deep insights to understand the “why” behind system behavior by parsing and contextualizing unstructured data.

Why Observability 2.0 Is Such a Gamechanger

One of the hardest parts of my job is to get people to appreciate just how much of a difference Honeycomb/observability 2.0 is compared to their current way of working. It’s not just a small step up or a linear improvement. Rather, it’s an entire step change in the way that you write, deploy, and operate software for your customers.

How to Optimize Costs and Strengthen IT with Teneo's Deep Observability

Teneo understands that it can be hard to balance cost and depth of observability in todays fast-paced digital landscape, where organizations face the challenge of managing increasingly complex IT infrastructures while keeping costs under control. Achieving this balance requires a new approach, this is why we have developed our Open Observability platform, a critical component of Teneo’s StreamlineX framework.

Kubernetes Monitoring and Alerting Made Easy with Splunk Observability Cloud and OpenTelemetry

In this video, I'll show you how to quickly setup monitoring and alerting for your Kubernetes clusters using Splunk Observability Cloud. We’ll start by deploying the Splunk OpenTelemetry Collector using Helm, and then use the Kubernetes Navigator inside Splunk Observability Cloud to view the health of our cluster and the applications it’s hosting. I’ll demonstrate AutoDetect detectors and alerts by intentionally triggering an issue in the cluster and walk through the alerting process. We’ll review the alerts in Splunk Observability Cloud and then resolve the issue in the cluster.

Keeping Spending in Check: Observability's Positive Impact on Cost Management

Tool sprawl within organizations doesn’t just create a fragmented user experience; it poses a real threat to enterprises’ bottom lines. Consider these statistics: This fragmentation significantly limits worker productivity. IT leaders spend hundreds of hours trying to manage multiple tools, map their environments, and upkeep aging systems that are either outdated or simply no longer necessary.

Kentik - Cloud Observability

Kentik Cloud provides comprehensive visibility across all major public clouds, offering seamless insight into cloud-to-on-prem network paths and the public internet routes connecting them. Identify latency, loss, jitter, and application-specific traffic while providing deep visibility into cloud networking constructs like ACLs to spot security issues. With powerful analytics, Kentik Cloud enables you to visualize intra-cloud traffic, identify idle resources for optimization, and leverage historical data to uncover trends and seasonal patterns—ensuring optimal cloud performance and cost efficiency.

Booking.com's Journey to Enhanced Observability

Since its early startup beginnings in Amsterdam, Booking.com has redefined the travel industry, establishing itself as a premier platform for millions of travelers worldwide. With over 28 million accommodation listings and a staggering 1.5 million room nights booked every day, Booking.com operates on a scale that demands a robust and constantly monitored infrastructure.