Operations | Monitoring | ITSM | DevOps | Cloud


The latest News and Information on Observabilty for complex systems and related technologies.


Monitoring as code: what it is and why you need it
“Everything as code” has become the status quo among leading organizations adopting DevOps and SRE practices, and yet, monitoring and observability have lagged behind the advancements made in application and infrastructure delivery. The term “monitoring as code” isn’t new by any means, but incorporating monitoring automation as part of an infrastructure as code (IaC) initiative is not the same as a complete end-to-end solution for monitoring as code.

Honeycomb Raises $20M to Define the Future of Observability
I’m delighted to announce that Honeycomb has raised $20M in Series B funding, led by e.ventures Growth, with participation from existing investors Scale Venture Partners, Storm Ventures, Next World Capital, and Merian Ventures, and joined by Industry Ventures. Honeycomb has led the conversation and momentum behind observability for years, and now we’re poised to scale the product, community, and practice even further.

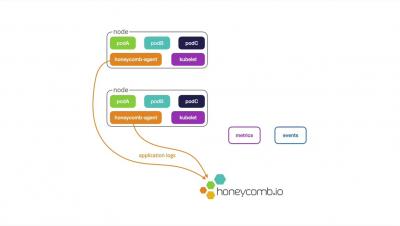
Kubernetes Observability Challenges: The Need for an AI-Driven Solution
Kubernetes provides abstraction and simplicity with a declarative model to program complex deployments. However, this abstraction and simplicity create complexity when debugging microservices in this abstract layer. The following four vectors make it challenging to troubleshoot microservices.
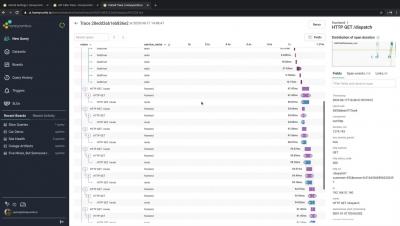
Observability Platform Demo

Monitoring vs Observability: Can You Tell The Difference?
Monitoring vs observability – is there even a difference and is your monitoring system observable? Observability has gained a lot of popularity in recent years. Modern DevOps paradigms encourage building robust applications by incorporating automation, Infrastructure as Code, and agile development. To assess the health and “robustness” of IT systems, engineering teams typically use logs, metrics, and traces, which are used by various developer tools to facilitate observability.