Operations | Monitoring | ITSM | DevOps | Cloud

Usual Performance Suspects: Introducing Suspect Spans

A trace is the end-to-end journey of one or more connected spans and a span is an operation or “work” taking place on a service. So when it comes to debugging a performance issue, being able to pick out slow spans out of a line up is the fastest way to seeing the root cause and knowing how to solve it. Suspect Spans surfaces a list of spans that correspond to where the most time in a transaction is spent.

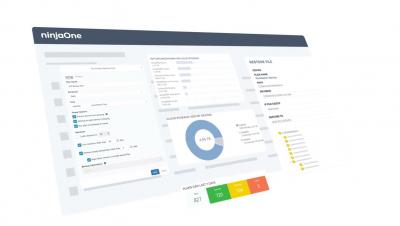
Replacing your backup solution: part one, learning why

So, you’re thinking about replacing your current backup solution. Well, before you start requesting price quotes and comparing feature matrixes you should understand that a change can have both short-term and long-term impacts. The extent of the impact depends on several factors, including why your clients need backup, how those backups are being performed, whether they have ever experienced data loss, and how long they need to retain backup data.

Bootstrapping a cloud native multi-data center observability stack

Bram Vogelaar is a DevOps Cloud Engineer at The Factory, and he recently delivered an intro to observability talk during our Grafana Labs' EMEA meetup. When I talk to customers, they might tell me about how their applications are running in two data centers, but when we probe a little further, it turns out that their observability stack is only available in one of them. This revelation hit close to home last March.

Logstash: Path to ECS for 8.0

The Elastic Common Schema is a community-driven effort to provide consistent semantic meaning to datasets so that data from disparate sources can be meaningfully used together. In Logstash 8.0, ECS compatibility is on-by-default — this is a pretty major change to how many plugins operate. In this talk, we outline the rationale behind the transition and also highlight how to opt-OUT of the transition with a simple pipeline setting.