Operations | Monitoring | ITSM | DevOps | Cloud

%term

Monitoring Server Performance

This is the first in a series on server monitoring. The primary focus of these posts is monitoring in a *nix environment. Monitoring servers is important. Whether it be finding an issue in a test environment prior to deploying or debugging an issue in production, we need access to information on our server to be able to tease apart what went wrong.

Minimize Risk with Continuous Integration (CI) and Deployment (CD)

Ahoy there. Continuous shipping: a concept many companies talk about but never get around to implementing. In the first post of this three-part series, we discussed the use case for continuous shipping. Let’s move on to part two: the integration and deployment stages of the continuous shipping process. Part three will wrap up the series with a look at the monitoring and feedback phases. All aboard that’s coming aboard.

Unearth new repositories and Git v2 improvements in Bitbucket Server 5.13

How much time do you spend every week trying to find things? At home, it’s finding your keys and, at work, it’s finding the root cause of a bug or an old pull requests that introduced the bug. Since we’re not in the business of tracking your keys, Bitbucket Server 5.13 is making it easier to discover repositories and find pull requests tied to a given commit. You can also enjoy support for Git v2, with faster no-op fetches.

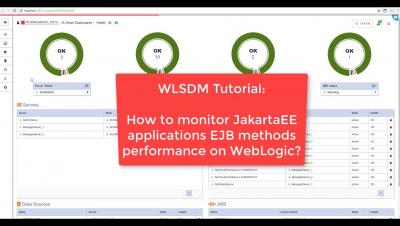
How to Monitor JavaEE Applications' EJB Method Performance on WebLogic?

WLSDM has back-end dashboards that offers monitoring EJB container. On WLSDM EJB dashboard you are able to view EJB Business Methods, its applications and method duration... etc. You can set alarm and configure EJB method duration threshold in "Monitoring & Diagnostics" page. You will be notified if EJB performance duration exceeds the threshold that you have defined.