Written by Microsoft MVP Nick Cavalancia. Earlier this month, Microsoft announced the 2022 rollout of Mesh for Microsoft Teams as the next step in online and virtual collaboration. This seemingly bold step forward into a new type of interaction between individuals is more a natural evolution, taking years of augmented reality research and applying it in a way that provides value to organizations wanting to better collaborate.
Have you heard about the Puppet Practice Labs? Our free, browser-based, hands-on labs cover a variety of topics for getting started with Puppet — everything from installing the primary server to identifying server roles using package data collection, and much, much more. You can read more about them in my previous blog post. We’ve designed Puppet Practice labs to make learning Puppet fun, engaging, and memorable for learners of all levels.
Epinio, the application development engine for Kubernetes, is meant to take you from app to URL in one step. It does that by either applying buildpacks to your app or using a pre-built docker image. Epinio installs into any Kubernetes cluster to bring your application from source code to deployment and allow for developers and operators to work better together.
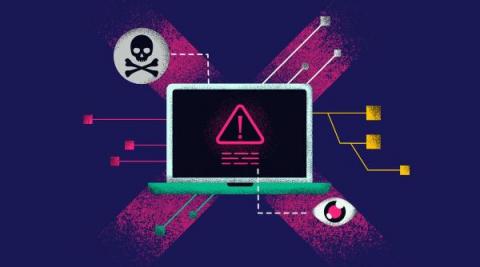
It feels like cybersecurity is dominating the newsfeeds, doesn’t it? There is a reason. Cyberattacks and cybercrime have risen dramatically in the last five years. 2020 broke all records in terms of data loss and the number of cyberattacks. Between 2019 and 2020 ransomware attacks alone rose by 62%, the same year that the World Economic Forum identified cyberattacks and data theft as two of the biggest risks to the global economy.
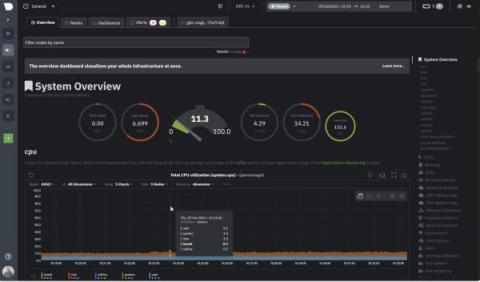
Netdata excels in collecting, storing, and organizing metrics in out-of-the-box dashboards for powerful troubleshooting. We are now doubling down on this by transforming data into even more effective visualizations, helping you make the most sense out of all your metrics for increased observability. The new Netdata Charts provide a ton of useful information and we invite you to further explore our new charts from a design and development perspective.