What's new in Sysdig - February 2022
Welcome to the second iteration of What’s New in Sysdig in 2022! Before starting, once again, we wish you a happy Spring Festival, Seol-Nal, Tet Nguyen Dan, Tsagaan Sar, and Lailat al Miraj.


Welcome to the second iteration of What’s New in Sysdig in 2022! Before starting, once again, we wish you a happy Spring Festival, Seol-Nal, Tet Nguyen Dan, Tsagaan Sar, and Lailat al Miraj.
While Go provides a testing package and a go test command, the former only offers basic testing capabilities. The package also has some drawbacks, such as missing assertions and increasing repetition with large-scale tests. As a result, several Go testing frameworks have been created to augment it. Go testing frameworks consist of tools and resources for creating and designing tests. Some of these frameworks incorporate the testing package and go test command, while others take a different approach.
Over the past few months, we set out to drastically reduce the amount of time Code Manager takes to deploy code and sand down some rough edges to make it more stable and robust. In order to understand what we were able to achieve, we need a quick primer on how code is deployed to a Puppet Server in the first place. There are three parts to a Code Manager code deployment: We’ve improved each of these three parts of the Code Manager code deployment.
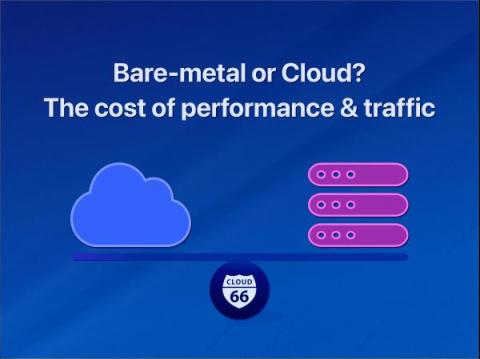
Bare metal servers are a valuable option for all sizes of businesses, including small, medium, and startups companies. When designing infrastructure it is important to manage cost. However, the decision on whether to run your application on bare metal or cloud provider should not be driven by the size of your company but by your infrastructure needs. Each approach has its own tradeoffs and complexities, especially since it is difficult to find two clouds with the same parameters.
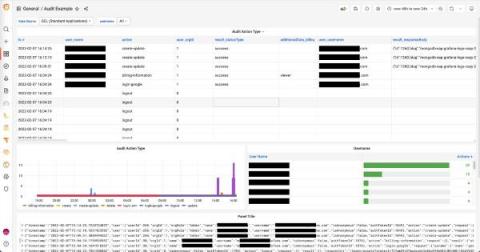
One of Grafana’s most powerful features is the ability to funnel data from hundreds of different data sources (i.e., services or databases) into a single dashboard without migrating the data from where it lives. You can connect and correlate data from Grafana’s curated observability stack for metrics, logs, and traces, or third-party services, such as Splunk, Elasticsearch, Github, Jira, and many more.
In the field of Chaos Theory, there’s a concept called the Synchronization of Chaos—disparate systems filled with randomness will influence the disorder in other systems when coupled together. From a theoretical perspective, these influences can be surprising. It’s difficult to understand exactly how a butterfly flapping its wings could lead to a devastating tornado. But we often see the influences of seemingly unconnected systems play out in real life.
Being new in tech an be intimidating! Thankfully, folks like Carissa Morrow are shining examples of how to come into tech from the ground up. Carissa began with a career shift and just started coding, went through the Boise Codeworks bootcamp, and made the jump to tech. Carissa talks about the resilience it took in her early days, and how those experiences reinforced her attitude on continually learning.
For most of my career I’ve worked with health and wellness startups. Most of these companies have a wearable that tracks movement, heart rate, body weight or stimulates a body part. The common denominator between these apps is their use of sensor data to determine physiological progress an athlete is making. Problem is, your Bluetooth Low Energy (BLE) device does not have an internet connection and cannot send diagnostics anywhere if there are errors.