Operations | Monitoring | ITSM | DevOps | Cloud

%term

The key benefits of Azure disk monitoring

Virtual machines (VMs) deliver flexible, scalable, and cost-effective computing solutions for businesses of all sizes. Microsoft Azure offers efficient and powerful VMs, but as infrastructures boom, the computing environment tries to accommodate the increased demands of the infrastructure. As VM demand increases, it can impact their performance and disk operations. This leads to performance degradation, storage fragmentation, capacity constraints, and increased risk of disk failure.

From DevOps to Platform Engineering: The Next Evolution

As organizations continue to navigate the complexities of modern IT environments, the evolution from “DevOps” to “platform engineering” has emerged as a crucial next step in maximizing operational efficiency. By reimagining DevOps as platform engineering, organizations can create a more cohesive and streamlined approach to IT operations and development, breaking down the silos that often impede progress. In this webinar, the Cloudsmith team will explore Omdia’s latest Market Disruptors Report and discuss which critical success factors you need to consider before making the transition to platform engineering.

Advanced Device Management: Automate Custom Properties in N-central

Discover how to enhance your device management with N-central by creating custom properties to store critical information like public IP addresses and BitLocker Recovery Keys. In this video, Paul Kelly from the N-able Head Nerd Team guides Managed Service Providers (MSPs) through setting up scheduled tasks that automatically gather and store additional device data.

Ribbon Voice Network Transformation - The Savings Pay for the Conversion

Ribbon's Fixed Network Transformation solutions consolidate and modernize infrastructure, eliminating inefficiencies. Ribbon provides solutions to transform both the core IP and optical networks and the IP-based communications services that run on top of that network, helping service providers expand and improve business services as well as enter new markets like unified 5G xhaul and broadband backhaul. At the same time, these transformations reduce the cost and complexity of delivering traditional residential communications services by dramatically reducing recurring power, HVAC, space, and staffing costs.

Dynatrace vs AppDynamics - A Feature Comparison Guide

Dynatrace and AppDynamics are two of the most well-known Observability and monitoring tools. Even though they share many features, they have several differences that might make you choose one over the other. Dynatrace is great for comprehensive system performance monitoring. It covers everything from infrastructure and application performance to log management and real user monitoring. AppDynamics, on the other hand, focuses more on application performance and business transactions.

WWDC 2024: What IT Admins Need to Know About Apple's Announcements

Apple's announcements at this year’s Worldwide Developers Conference have surprised everyone with new capabilities designed to make the IT admin's life easier for managing and securing devices. As we expected, Apple kept expanding declarative management configurations and capabilities for securing iPhones and iPads and robust management of macOS in the enterprise.

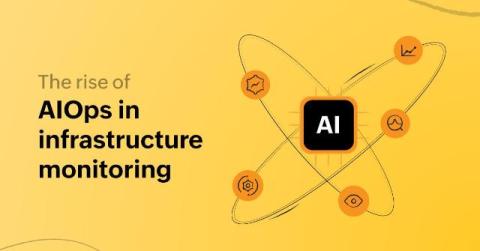
The rise of AIOps in infrastructure monitoring

Drowning in data from complex environments? Ditch the reactive approach. Artificial intelligence for IT operations (AIOps) empowers proactive management with comprehensive observability. According to Gartner, IT spending will continue to mount sky-high despite the global economic instability; the IT expenditure is predicted to surge by 8.6% in 2024. Manual monitoring often fails to keep up with the complexity of modern IT environments, leaving critical issues undetected.

Grafana Alloy 1.3 release: Debug pipelines in real time

Grafana Alloy 1.3 is here! First introduced earlier this year, Alloy is our open source distribution of the OpenTelemetry Collector. It has native pipelines for OpenTelemetry and Prometheus telemetry formats, and it uses the same components, code, and concepts that were previously introduced in Grafana Agent Flow. This new release introduces live debugging, enhancing debugging capabilities across key components, which are the building blocks of Alloy.