Operations | Monitoring | ITSM | DevOps | Cloud
Reduce compliance TCO by using Grafana Loki for non-SIEM logs
Compliance is a term commonly associated with heavily regulated industries such as finance, healthcare, and telecommunication. But in reality, it touches nearly every business today as governments and other regulatory agencies seek to enact tighter controls over the use of our collective digital footprint. As a result, more and more companies need to retain a record of every single digital transaction under their control.
A year in Mimir: Massive scale, new metrics formats, increased adoption
When we introduced Grafana Mimir into the open source ecosystem, we weren’t shy about our ambitions. Once we got past answering some of the easier questions (For the record, the name Mimir comes from Norse mythology, and it’s pronounced /mɪ’mir/.), we quickly got to work making good on our promise to deliver the most scalable, most performant open source time series database (TSDB) in the world.
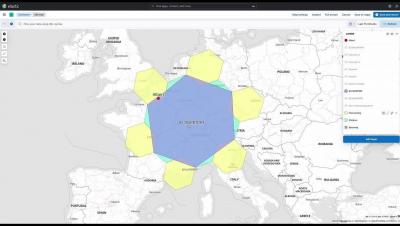
How Geometric Search Works for Hexagons in Elasticsearch
Kibana Demo of Hexagonal Clusters
Meet the minds behind Grafana Pyroscope: Christian, Cyril, Dmitry, and Ryan
What do you get when you combine the wit, wisdom, and weird humor of four talented tech minds? As it turns out, a surprisingly lively Q&A! As Grafana Pyroscope emerges from the union of Grafana Phlare and Pyroscope, it’s time to really get to know the people behind these continuous profiling projects. That’s why we brought together the Pyroscope founders, Dmitry Filimonov and Ryan Perry, and Phlare technical leads, Cyril Tovena and Christian Simon, for this light-hearted conversation.
New One-click Dashboard Templates in eG Enterprise v7.2
One-click dashboard templates are among a number of tools available within eG Enterprise to allow organizations to rapidly set up targeted and bespoke views for a wide range of audiences across their organizations, whilst avoid the costs and inconsistencies of building and maintaining many individual dashboards.
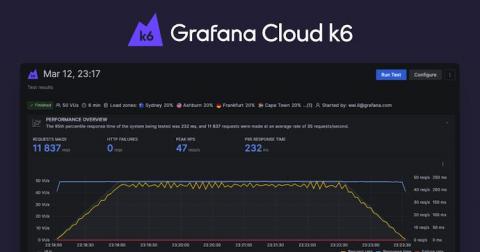
Introducing Grafana Cloud k6: unified performance testing and observability
Organizations use load and performance testing to prevent issues from impacting customers, which is essential if they want to stay relevant in today’s digital-first world. And with the rise of cloud native technology and DevOps, software teams must shift performance testing left, towards development. However, traditional load and performance testing tools simply haven’t kept pace, leaving developers, operations, and QA teams siloed.
Introducing Grafana Cloud k6
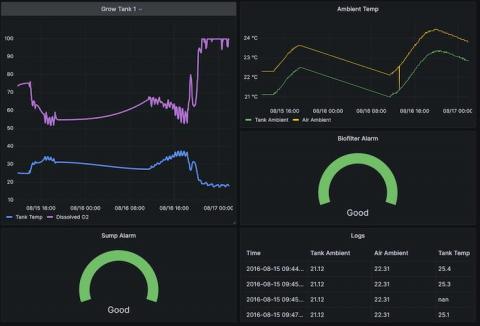
From fish tanks to data banks: finding Grafana on a farm
I started a fish farm because I realized that the three marine biologists in the world weren’t giving up their jobs. It was 2014 and I had just finished a degree in marine ecology, so it seemed like a good idea in my head. Of course, actually building and operating a fish farm — technically, an aquaponics farm — turned out to me much harder than I ever expected.


