Operations | Monitoring | ITSM | DevOps | Cloud

Dashboards

Introducing template variable saved views for dashboards

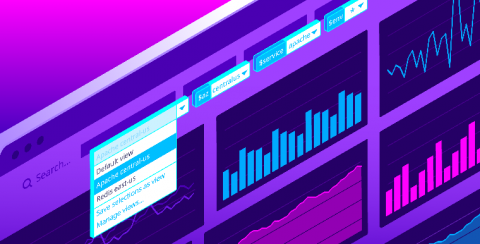
Datadog dashboards provide immediate visibility and insight into your environments. Setting template variables enables you to filter your dashboard graphs on the fly to visualize specific sets of tagged objects. Now, with saved views, you can save sets of frequently used template variables in order to easily find the data you most care about with just a few clicks.

Grafana 7.0 sneak peek: Inspect drawer lets you get raw data and download as CSV

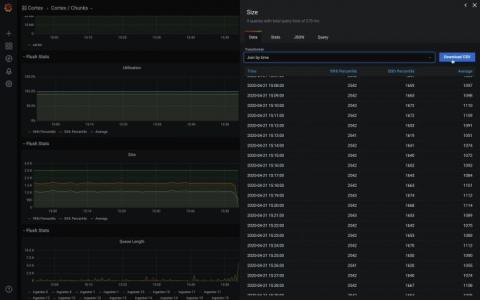
Grafana v7.0 is coming soon! Here’s another sneak peek of one of its features: the inspect drawer. The inspect drawer is a feature that every panel will support, including internal as well as external community plugins. In this new drawer, you will be able to view the raw data in a table format, apply some predefined transformations, and download as CSV. “Download as CSV” previously only existed as a custom feature for the Graph & Table panel.

Kibana 7 and Beyond Logz io Enhancements for Success

Kibana 7 introduced some new changes to the popular visualization platform, and this webinar will address how those updates are reflected in Logz.io. The recent enhancements included a cross-app dark theme, a new time picker, new filtering, a better dashboarding experience, and a significant boost in performance. But have the changes impacted your Logz.io user experience? We will dig in and detail how you can avoid common pitfalls and challenges. Expect to learn about.

Grafana 7.0 preview: New image renderer plugin to replace PhantomJS

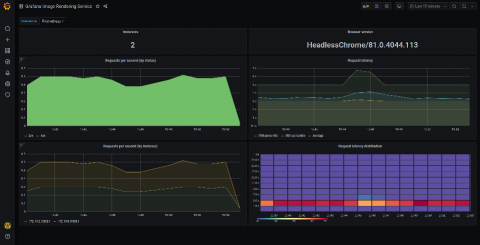
Many Grafana users export images of their dashboard panels. This feature powers the ability to receive alerts with a rendered image of the panel attached, which is valuable for quickly spotting if something is about to go sideways in production. Since Grafana v2.0, when support for server-side rendering of dashboard panels as images was introduced, PhantomJS has served as the built-in image renderer that enables this feature.

Release Webinar: SquaredUp 4.6

Join our Senior Product Team for an in-depth tour of SquaredUp v4.6. John Shaw (Chief Product Officer) and John Knowles (Director of Products) will take you through the impressive product enhancements included in our latest release. Improvements spanning both our SCOM and Azure products include Dark Theme Open Access and Dashboard Pack upgrades. Azure-specific upgrades include deeper insights from Azure Cost Management, Azure Lighthouse support and an improved trial and install experience.

How isolation improves queries in Prometheus 2.17

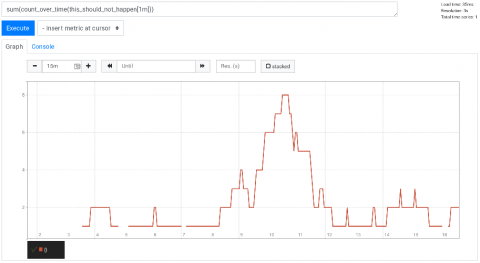
There are instances in life when isolation is actually welcome. One of those instances pertains to the I in the acronym ACID, which outlines the key properties necessary to maintain the integrity of transactions in a database. The time series database (TSDB) embedded in the Prometheus server has the C (consistency), the D (durability), and – somewhat debatable – the A (atomicity). But up until and including Prometheus v2.16, it did not have the I (isolation).

Improving Graphite rollup and runtime consolidation in Metrictank and Grafana 7.0 with lineage metadata

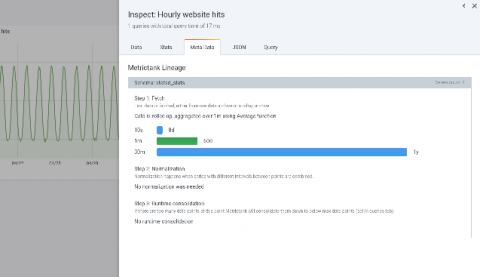
The Grafana and Metrictank/Graphite teams have been hard at work to deliver an exciting new feature for the upcoming Grafana v7.0 release: a rollup indicator and series lineage metadata breakdown for Metrictank. This blog will cover the new functionality around Metrictank metadata, the rollup indicator, and the lineage visualization coming in 7.0.