Operations | Monitoring | ITSM | DevOps | Cloud
Testing with k6 + Grafana: Better together by Nicole van der Hoeven
Tales of A11y In Grafana OS: Introducing Pa11y CI into our pipeline by Alexa Vargas
Using Thanos to gain a unified way to query over multiple clusters by Wiard van Rij
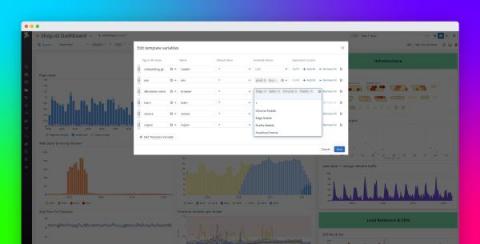
Filter dashboards faster with template variable available values
Datadog’s template variables help you quickly scope your dashboards to specific contexts using tags, so you can visualize data from only the hosts, containers, services, or any other tagged objects you care about. This helps you build more flexible dashboards so you can access the insights you’re looking for as quickly as possible. We’re proud to announce new features for the template variable workflow that enable you to make highly dynamic, shareable dashboards more efficiently.
Grafana 8.2 released: Dynamic plugin catalog, new fine-grained access control permissions, and more
Grafana 8.2 is here! This release marks the start of our work focused on measurable improvements to Grafana’s accessibility — part of our continuing mission to democratize metrics for everyone. The initial changes to Grafana in 8.2 are focused on navigation, with more to come. We’ll be sharing more about our accessibility roadmap in an upcoming blog post.
New release: SquaredUp 5.3
SquaredUp 5.3 is now available! You will find new features to discover as well as enhancements to the SquaredUp you already love. Here are the highlights: Check out our release webinar for a detailed walkthrough and demo.
Dashboard Fridays
We are excited to announce a new community initiative – Dashboard Fridays. Dashboard Fridays is a bite-sized video series where we share and discuss a range of different dashboards created for the community, by the community. Each video is no longer than 20min, so grab a coffee and let’s talk dashboards! Each episode, we will zoom in on one stellar dashboard put together by a member of the community.
Is service catalog the modern CMDB?
SquaredUp recently launched a PowerShell tile that lets you visualize data returned from a PowerShell script. This has opened virtually infinite doors to the sources you can get data from. PowerShell can work with crazy text formats obscure databases, and endpoints that are open on the internet. If you can access it, PowerShell can work with it. And SquaredUp lets you leverage that power so you can get the information you need and visualize it in a format that makes sense.


