Operations | Monitoring | ITSM | DevOps | Cloud

Dashboards

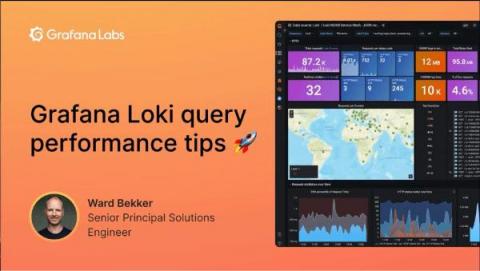
Watch: 5 tips for improving Grafana Loki query performance

Grafana Loki is designed to be cost effective and easy to operate for DevOps and SRE teams, but running queries in Loki can be confusing for those who are new to it. Loki is a horizontally scalable, highly available, multi-tenant log aggregation system inspired by Prometheus. It doesn’t index the content of the logs, but rather a set of labels for each log stream.

New Year's (observability) Resolutions

A new year has started and I've been pondering my hopes and dreams for the year to come. In the world of SRE, observability is the most prominent pillar of my work. So, I decided to drill into the topic of observability and what I'd like to see happen in the industry in 2023. Rather than focusing on any tool, technology, or methodology, I'lll be exploring concepts that can be broadly applied in any organization.

How to forecast holiday data with Grafana Machine Learning in Grafana Cloud

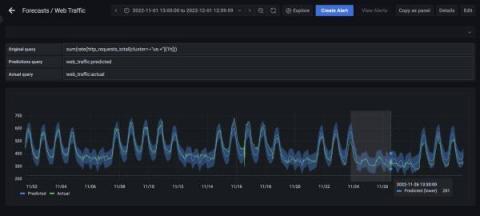
A little over a year ago, we released Grafana Machine Learning, enabling Grafana Cloud Pro and Advanced users to easily view forecasts of their time series. We recently enhanced Grafana Machine Learning with Outlier Detection, which allows you to monitor a group of similar things, such as load-balanced pods in Kubernetes, and get alerted when something starts behaving differently than its peers.

Spot Eco: Introducing a faster, more flexible dashboard

With Eco’s automated reservation management, maximizing savings on your cloud bill and increasing your team’s bandwidth is easy. The new dashboard now includes responsive modular components and an improved commitment filter, so tracking savings and monitoring your environment is even easier.

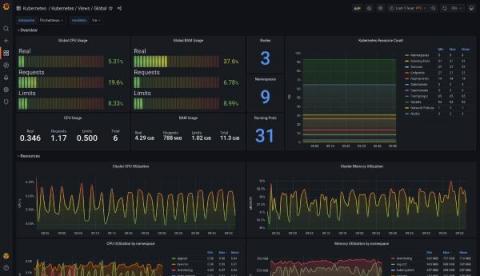
How to monitor Kubernetes with Grafana and Prometheus: Inside Powder's observability stack

David Calvert is a site reliability engineer working remotely from the south of France. He’s currently focused on observability, reliability, and security aspects of cloud infrastructure. You can find him as dotdc on GitHub and @0xDC_ on Twitter. Over the past three years, I’ve built and operated Kubernetes clusters for two different companies — the first one on-premises, and the second on a public cloud platform for my current job at Powder.

How to use the Grafana Ansible collection to manage Grafana Agent across multiple Linux hosts

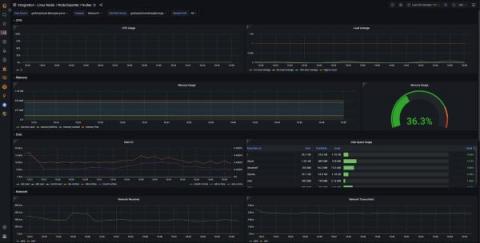
Anyone who is trying to set up monitoring for multiple machines knows how tough it can get to manage multiple Grafana Agents across them. To make things easier, we recently added the Grafana Agent role to the Grafana Ansible collection, which will help users manage the Agent across multiple Linux hosts. (Need to know how to get started with the Grafana Ansible collection for Grafana Cloud?

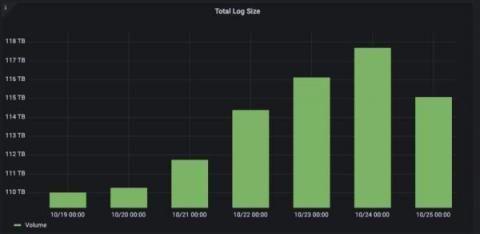
4 billion logs, 120 TB of data: How Just Eat Takeaway.com uses Grafana Cloud to scale

In 2017, Just Eat Takeaway.com (JET) was transitioning from a scrappy startup to a surging scaleup. With a global customer base and workforce, the food delivery marketplace’s front line teams needed to scale the real-time monitoring of the platform. Their initial efforts looked like “NASA’s mission control with Grafana dashboards,” said Senior Technology Manager Alex Murray.

Phantom Metrics: Why Your Monitoring Dashboard May Be Lying to You

Whether you’re a DevOps, SRE, or just a data driven individual, you’re probably addicted to dashboards and metrics. We look at our metrics to see how our system is doing, whether on the infrastructure, the application or the business level. We trust our metrics to show us the status of our system and where it misbehaves. But do our metrics show us what really happened? You’d be surprised how often it’s not the case.