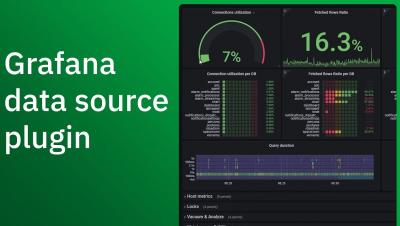
Over the last few months, a common and recurring theme in our conversations with users has been about managing observability costs, which is increasing at a rate faster than the footprint of the applications and infrastructure being monitored. As enterprises lean into cloud native architectures and the popularity of Prometheus continues to grow, it is not surprising that metrics cardinality (a cartesian combination of metrics and labels) also grows.
Grafana Loki is Grafana Labs’ open source log aggregation system inspired by Prometheus. Loki is horizontally scalable, highly available, and multi-tenant. In addition, Grafana Cloud Logs is our fully managed, lightweight, and cost-effective log aggregation system based on Grafana Loki, with free and paid options for individuals, teams, and large enterprises.
Measuring and improving the reliability of technical systems has always been challenging. As an industry, we've developed several practices to try and address reliability concerns, such as incident response, observability, and Chaos Engineering. This led SREs and service owners to measure reliability in a handful of ways.
Sometimes an IT ticket is just an IT ticket. But far more often, when one or a few tickets are submitted, it means there are many more users and systems exposed to the same issue. IT issues can quickly get out of control and affect many employees, sometimes overnight. When these get out of control, they can become “top call drivers” that bring your team, department, business lines, and even entire business to a halt.
When you want to direct your observability data in a uniform fashion, you want to run an OpenTelemetry collector. If you have a Kubernetes cluster handy, that’s a useful place to run it. Helm is a quick way to get it running in Kubernetes; it encapsulates all the YAML object definitions that you need. OpenTelemetry publishes a Helm chart for the collector. When you install the OpenTelemetry collector with Helm, you’ll give it some configuration.