Operations | Monitoring | ITSM | DevOps | Cloud

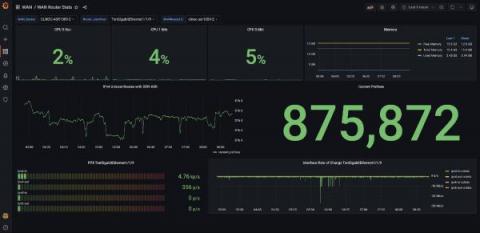
Building Grafana dashboards for a large-scale deployment in a tight timeline: Inside Cisco Live

How many Marvel movies’ worth of Internet traffic do 28,000 conference goers create during a five-day Cisco Live event? There’s a Grafana dashboard for that. Cisco Live is the network industry’s largest annual event, delivering education and inspiration to technology innovators worldwide with a week’s worth of programming keynotes, product announcements, entertainment, and more.

How a Product Studio Mitigates User Friction with Performance Monitoring

Panenco is a Product as a Service studio with more than 50 software development, product management, data science, design, and marketing experts building and hosting applications spanning multiple industries, including healthcare, fintech and education. For them, customer success isn’t just a business function, teams focus heavily on providing a fast, frictionless app experience.

Monitoring and Debugging Python Apps on AWS Lambda

As a developer, Python for me is a heavy-lifting and versatile language. I’ve used it for building APIs, internet of things projects, file and data conversions, machine learning and (of course) web development. Like with any modern, commonly used language, the functionality behind the application is only as good as the infrastructure that it is deployed onto.

Data Protection Methods for IT & MSP Teams

The two words that IT and MSP teams never want to hear are “data loss.” According to Business Partner Magazine’s article on data backup, “94% of companies that fail to recover from a major data loss do not survive, and 43% of companies never resume their operation after a major data loss event.” To prevent these disasters from occurring, IT & MSP teams rely on data protection.

Developer Week Cloud Austin: Hit or Miss?

Hi there, Albane writing, Product Marketing Manager at Qovery, writing to your from Texas 🤠 With Romaric (CEO at Qovery) and Morgan (Co-founder at Qovery), we spent the last two days promoting Qovery at the Developer Week Cloud that took space in Austin, Texas. After weeks of preparation, quite a few hours of travel, and a whole setup, let me give you some insights about our first-ever conference as an exhibitor!

A Guide to MQTT Messaging Brokers and Client Software

MQTT is a machine-to-machine communication protocol. Devices publish messages to a broker under specific topics, and other devices subscribe to those topics to receive information. It’s popular because it doesn’t take up a lot of bandwidth, so IoT devices with limited network connectivity can use it. MQTT works because of brokers. Each device sending and receiving data can communicate with potentially millions of other devices while only connecting to one broker.

Synthetic Monitoring for Windows, VDI & 2FA | 2 Steps

We relate synthetic monitoring to a heart rate monitor for application performance. It fits hand in glove with real user monitoring and provides insights into how real customers and employees are experiencing the application. Historically, we’ve seen limitations with real user monitoring. If nobody is on the network or using the application, then you're not receiving any performance data. Also, the performance data that you typically receive is from a panel rather than every single user.