Operations | Monitoring | ITSM | DevOps | Cloud

%term

Snowflake data visualization: all the latest features to monitor metrics, enhance security, and more

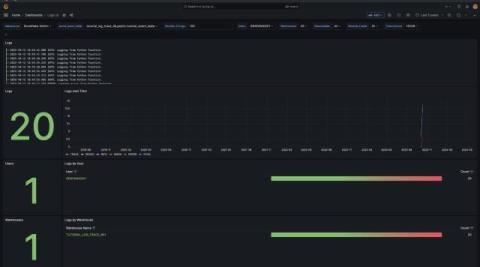
In 2020, we introduced the Snowflake Enterprise data source plugin for Grafana, allowing users to seamlessly pull data from the Snowflake cloud-based data storage and analytics service into Grafana dashboards. Available for Grafana Enterprise and Grafana Cloud users, it’s a powerful way to not only query and visualize Snowlake data, but to do so alongside other data sources, so you can discover correlations and other meaningful insights within minutes.

6 tips to improve your Grafana plugin before you publish

Whether they help you tap into external data sources or add a new visualization type to your dashboard, plugins are a powerful way to customize and extend the value of Grafana. There’s a rich (and constantly evolving) ecosystem of Grafana plugins you can choose from today. While some of these plugins are created and maintained by the Grafana Labs team, many of them are contributed by our commercial partners and community members.

How to reduce expenses on monitoring: be smarter about data

Monitoring can get expensive due to the huge quantities of data that need to be processed. In this blog post, you’ll learn the best ways to store and process monitoring metrics to reduce your costs, and how VictoriaMetrics can help. This blog post will only cover open-source solutions. VictoriaMetrics is proudly open source. You’ll get the most out of this blog post if you are familiar with Prometheus, Thanos, Mimir or VictoriaMetrics.

How to Set Up User Feedback from Sentry

Sentry’s User Feedback gives your users an easy way to provide direct input on problems they encounter on your site – whether that be a frontend error, broken link, or misleading label – to help get context into a known error or catch an issue that can only be spotted in the UX. This simple widget can be customized to match your site’s look and feel and embedded non-intrusively. Learn how to set it up with this step-by-step demo.

Effective Observability for MLOps Pipelines at Scale with Rishit Dagli

Join Rishit Dagli as he explores effective observability for ML pipelines at scale. Learn about the critical differences between observability and monitoring in ML applications, common challenges like distribution shifts, and feedback loops. Rishit demonstrates practical methods for logging and interpreting various metrics to maintain model performance and reliability.

Happy 10th Birthday Kubernetes!

As Kubernetes celebrates its 10th anniversary, it’s an opportune moment to reflect on the profound impact Kubernetes has had on the cloud technology landscape. Since its inception, Kubernetes has revolutionized the way we deploy, manage, and scale containerized applications, becoming the de facto orchestration platform for today’s cloud-native ecosystem.

Application Observability And Its Role In Modern Software Development

Over the last few decades, software systems have grown complex due to the emergence of cloud-native architectures and multi-cloud environments. On the one hand, this makes it difficult to detect issues faster in the deployed application. It also requires intricate coordination between development, DevOps, and SRE teams, as they are also expected to speed up the whole software delivery process.