Operations | Monitoring | ITSM | DevOps | Cloud

%term

Grafana Loki query acceleration: How we sped up queries without adding resources

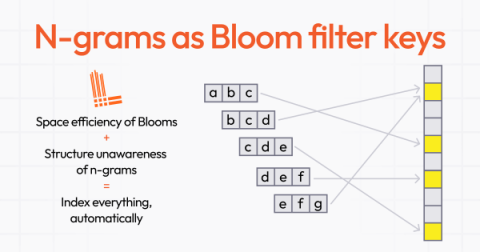
As we discussed when we rolled out the latest major release of Grafana Loki, we’ve grown the log aggregation system over the past five years by balancing feature development with supporting users at scale. A big part of the latter has been making queries much faster — and that was a major focus with Loki 3.0 too. We’ve seen peak query throughput grow from 10 GB/s in our Loki 1.0 days to greater than 1 TB/s even before 3.0.

VoIP and WAN Performance Monitoring and Troubleshooting with VoIP & Network Quality Manager

Tired of end-user complaints about VoIP call quality? Learn how SolarWinds VoIP & Network Quality Manager monitors WAN performance of your remote sites by tracking key edge-to-edge router and VoIP call paths to ensure call quality using Cisco IP SLA technology that can be used standalone or integrated seamlessly with Network Performance Monitor. VoIP & Network Quality Manager correlates call detail records (CDRs) with Cisco IP SLA Operations, and delivers VoIP call statistics for VoIP troubleshooting through a highly intuitive web interface that offers point-and-click simplicity and easy access to call performance statistics.

Removing ad trackers and cookies - the technical perspective

Sentry recently completed a multi-month project to remove all non-essential cookies and trackers from our public websites. For more context, see two blog posts that offer differing perspectives on the project: one from our marketing team, another from our legal team, and a third blog post that explains our privacy values and our ultimate motivation.

Getting Started: Your Ruby On Rails App Hosted On DigitalOcean With AppSignal

Imagine this: you’ve just finished working on your brand new Rails app and have deployed it to a cloud provider like DigitalOcean. Like any developer, you’re very proud of your work but you still have lots of questions, like: Your goal is to provide the best user experience. You want to be notified whenever errors or other important events occur so you can take care of them fast. It would be great to have a setup that automatically monitors your application. Enter AppSignal!

Track Errors in Your Python Flask Application with AppSignal

In this article, we'll look at how to track errors in a Flask application using AppSignal. We'll first bootstrap a Flask project, and install and configure AppSignal. Then, we'll introduce some faulty code and demonstrate how to track and resolve errors using AppSignal's Errors dashboard. Let's get started!

Create Personalized Knowledge Articles Faster and Smarter with Gen AI

Maintaining a deep catalog of knowledge articles to inform end users is an essential — yet often tedious — requirement for IT teams. But generative AI is offering a big assist. By using AI in knowledge bases, service desk agents who used to spend two or three hours creating each knowledge article from scratch can create drafts in minutes.

My 3 Lessons About OpenTelemetry for Observability

As a fan of OpenTelemetry, I love to see Cribl meeting customers where they are and helping them get to where they want to be with a vendor-agnostic approach. Where it is not possible or practical to re-instrument a telemetry source, whether an application or infrastructure, the barrier to adopting OpenTelemetry Signals can be daunting.

Webinar Recap: Unleash the Full Potential of Your Time Series Data with InfluxDB and AWS

Recently, TechCrunch hosted a webinar titled, “Unleash the Full Potential of Your Time Series Data,” featuring a discussion with InfluxData Founder and CTO, Paul Dix, and AWS General Manager for Timestream and Neptune, Brad Bebee, moderated by InfluxData staff engineer, Andrew Lamb.