Operations | Monitoring | ITSM | DevOps | Cloud

%term

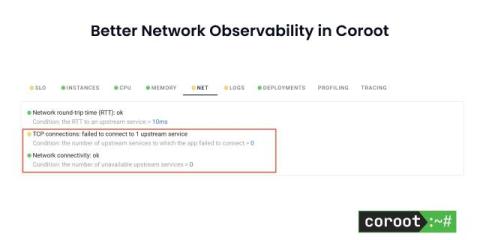
Better Network observability in Coroot

One service can’t connect to another (or can’t establish a database connection) – underneath this simple definition, there can be two very different conditions. First – we may have a service process down. In this case, the Kernel stack is operational, so we are getting the packet back, indicating the connection was refused. Second – when network flow is completely disrupted due to connectivity issues, firewall, or a node being completely down.

Drive Operational Excellence with PagerDuty

Build operational excellence with PagerDuty. Watch this demo to see how the latest innovations for the PagerDuty Operations Cloud come together to help a team tackle a major incident related to a database upgrade. You’ll see how PagerDuty Copilot capabilities work in concert with new functionality built for modernizing operations centers, standardizing automation at scale, and transforming incident management. The result? Improved innovation velocity, reduced operating costs, and better customer experiences.

Website Monitoring for Startups: Essential Strategies for Early Stage Growth

For startups, every interaction counts, and first impressions matter. So, website monitoring should be an integral part of any startup’s digital strategy. Ensuring your site is fast, available, and secure not only enhances user experience but also solidifies your reputation as a reliable and professional business. It’s not just about keeping your site online; it’s about offering a seamless, engaging user experience that can significantly influence your startup’s growth and success.

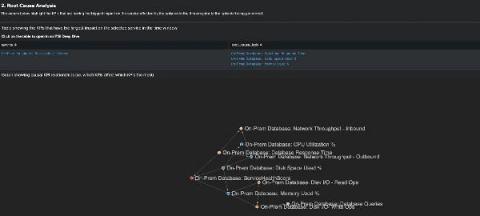
How To Visualize Business Service Performance with Splunk ITSI

The complex nature of modern digital landscapes means the ability to effectively monitor and understand its impact on your business is not just desirable — it's a necessity. This is where Splunk IT Service Intelligence (ITSI) comes into play. ITSI offers a sophisticated platform for service insights and detailed analytics that can be used by digital operations teams as the first step of a troubleshooting workflow.

What's New in Rightsizing in VMware Tanzu CloudHealth

In March of 2024, The FinOps Foundation announced an update to the FinOps Framework. Within that Framework, each domain is meant to describe a set of business outcomes that a mature FinOps practice should ultimately strive for. As an individual customer’s cloud usage grows and as they progress through their own cloud journey, they will end up working through their challenges in each of these domains. However, each customer’s cloud journey is rarely linear, and maturing is never easy.

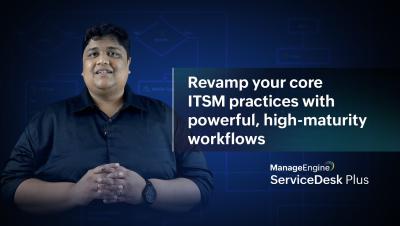
Revamp your core ITSM practices with powerful, high-maturity workflows

We are delighted to announce that workflow automation capabilities in ServiceDesk Plus Cloud just got more powerful! Workflows, which were previously available for changes and releases, have now been extended to other ITSM practices too. How can Workflows help your IT teams? Automate your service management practices end to end, on a single visual canvas. Perform bespoke actions by triggering low-code custom functions within Workflows. Orchestrate enterprise service operations across hybrid IT systems and services with just a single touch.

Ultimate Guide to SQL Indexes

Databases are essential for storing data and providing user access to specific information. This fundamental task becomes increasingly complex as databases expand, data volumes swell, and data processing times lengthen. For quick and efficient data retrieval from large databases, we use indexes. An SQL index functions similarly to an index in a book or journal, referring to data within tables. This article will explore SQL indexes, enhancing your understanding of database management.

Beginners Guide - All about Alert List visualization | Grafana

Do you want to know what an alert list visualization is and how you can create one in Grafana? Join Senior Developer Advocate Marie Cruz in this beginner-friendly tutorial to learn how alert list visualization works in Grafana. Grafana Cloud is the easiest way to get started with Grafana dashboards, metrics, logs, and traces. Our forever-free tier includes access to 10k metrics, 50GB logs, 50GB traces and more. We also have plans for every use case.