Operations | Monitoring | ITSM | DevOps | Cloud

%term

Grafana 11 Now GA: Here's the TL;DR | Grafana

Grafana 11 is here! Our next major release is now GA. Think of it as your quick guide to all of the new goodies! Grafana Cloud is the easiest way to get started with Grafana dashboards, metrics, logs, and traces. Our forever-free tier includes access to 10k metrics, 50GB logs, 50GB traces and more. We also have plans for every use case.

Evolutionary Query: The Rise of PostgreSQL

The latest release of SolarWinds Database Performance Analyzer (DPA) software includes table tuning and index advisors for PostgreSQL—building on DPA’s existing performance monitoring capabilities. Over the last thirty-five years, there’s been a steady rise in the role and evolution of open-source technology—including in the competitive world of database management software. Big names in the world of open-source tech for database management include MySQL, MongoDB, and PostgreSQL.

How To Monitor Linux Network Usage - Top Network Monitoring Tools

Network monitoring is important for keeping any network healthy and working well. Linux has many powerful tools to help system administrators monitor network traffic and fix problems. This article looks at six of these tools: NetHogs, nload, netstat, iftop, speedometer, and NetFlow.

What Is an SSL Certificate? How Does SSL Work?

SSL/TLS certificates are important for protecting online communication between websites and users. These digital certificates work as identity cards, checking the authenticity of a website and creating an encrypted connection to safeguard sensitive data. In this article, we will explain what SSL/TLS certificates are, how they function, and their role in maintaining online security and privacy.

Empowering Engineering Excellence: Achieving a 26% Reduction in On-call Pages at Amperity with Modern Observability for Logs

Amperity required an observability partner to facilitate their transition into the modern engineering era as their previous tooling struggled to support their growth strategy. When customer data is scattered everywhere, how do you put the pieces together to get an accurate customer 360° view? That’s the power of Amperity’s customer data platform (CDP), and the company has been driving customer data innovation for nearly a decade.

What's My IP? Find out with These 6 Best IP Checkers

When surfing the web, your connection is linked to a unique identifier known as an IP address. Your IP address is like your digital identity card and can reveal the following information: Despite what you may see in films or TV shows, your IP address does not show the following information: While an IP address doesn't reveal much personal information, it can be used with other data to build a profile of your online activity. This is why you may ask yourself, what is my IP address?

How reliability differs between monolithic and microservice-based architectures

Microservices have forever changed the way we build applications. Tools like Docker and Kubernetes made microservice-based architectures widely accessible to software developers, and cloud platforms like Amazon EKS made deploying containers fast and inexpensive. They've also enabled even small engineering teams to deploy code faster, leverage fault tolerance and redundancy, scale more efficiently, and take full ownership of their services from development all the way into production.

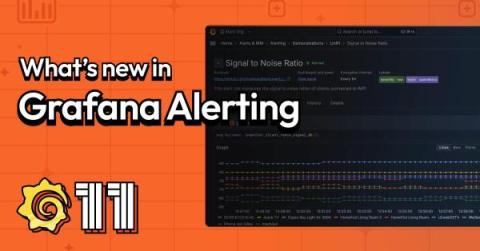
Grafana Alerting: new tools to resolve incidents faster and avoid alert fatigue

The maturity of your alerting strategy has a direct impact on the reliability of your infrastructure and your applications. It can also have a big impact on engineering productivity. So whether you’re talking about resolving incidents faster or avoiding alerting fatigue, alerting should always be front and center.

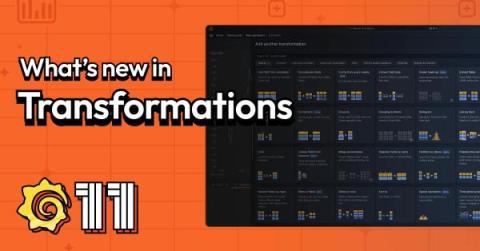
Grafana transformations: 10 new ways to get more out of your data

One of the superpowers of Grafana is the ability to bring all of your data into a single platform thanks to our rich catalog of data sources. Oftentimes you will want to visualize information from disparate data sources together in a single dashboard or panel. Or you might want to refine data returned from queries without altering the original data source. Or you may need to modify data due to limitations of a query language that stops you from getting the required formatting.

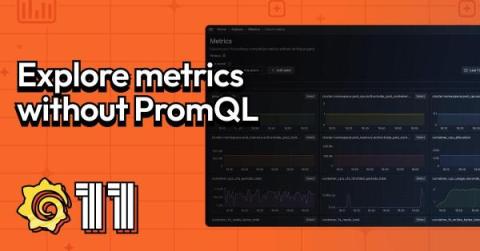
How to explore metrics without PromQL queries in Grafana

At GrafanaCON 2024, Grafana founder Torkel Ödegaard introduced Grafana 11, which has a feature set that aligns with the same goals we’ve had since the OSS project launched in 2013. “The core mission of Grafana that we’ve had from the start is to make observability easy and powerful through good UX design, a focus on ease of use, and user flexibility and freedom,” Torkel said.