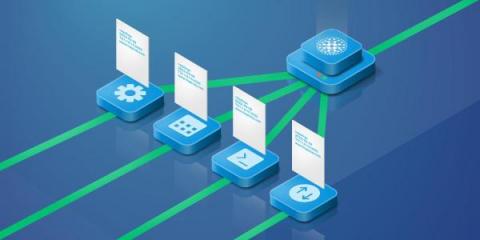
When an incident happens, most organizations have a way of identifying all affected services. The trouble is, it’s often a human-centered process that depends on the knowledge of key individuals or manually updated documentation. There might be a version in your alerting tool, a version in your corporate Wiki, and a different version still in your team’s head.
If you’re a 1.x user of InfluxDB, you might be a Kapacitor user as well. If so, you’re also familiar with TICKscripts, the data processing and transformation language for Kapacitor, the batch and stream processor for InfluxDB. Kapacitor is a great tool, but it’s largely a black box, so using and implementing TICKscripts to execute data processing tasks, checks, and notifications can be a challenging developer experience.
In the previous “Flowmon and WhatsUp Gold: Discover application experience issues through single pane of glass” blog post we have demonstrated how IT Infrastructure Monitoring (WhatsUp Gold) and Network Performance Monitoring & Diagnostics (Flowmon) work seamlessly together to report on application performance, user experience and infrastructure status.
When security analysts choose technology, they approach the process like a mechanic looking to purchase a car. They want to look under the hood and see how the product works. They need to evaluate the product as a technologist. On the other hand, the c-suite has different evaluation criteria. Senior leadership approaches the process like a consumer buying a car.
Oftentimes, people starting their journey in the field of software development don’t understand the importance of testing, including Golang app testing, until late in their careers. It’s essential to think about testing as an integral part of the software development lifecycle (SDLC) not only in theory but in practice, too. When building cutting-edge software, you need to make sure that the version being upgraded is error-free and that almost all of the failure cases have been considered.
Any significant shift in an organization’s software engineering culture has the potential to feel tectonic, and observability (o11y for short)—or more specifically, Observability Driven Development—is no different. Leaning into observability, which calls for tool-enhanced investigation, hypothesis testing, and data richness can be cumbersome even for the most veteran of teams.
As the adtech industry continues to expand and the volume of ads sold and served grows exponentially, the only way to manage the business is through programmatic advertising. This approach utilizes data insights and algorithms to automatically serve ads to the right user, at the right time, on the right platform, and at the right price. The speed and scale of online advertising means that adtech companies need to collect, analyze, and act upon immense datasets instantaneously, 24 hours a day.
WordPress is a popular platform for editing and publishing content for the web. This tutorial will walk you through how to build out a WordPress deployment using Kubernetes, ArgoCD, Crossplane, and Shipa. WordPress consists of two major components: the WordPress PHP server and a database to store user information, posts, and site data. We will define these two components and store them in a Git repository.