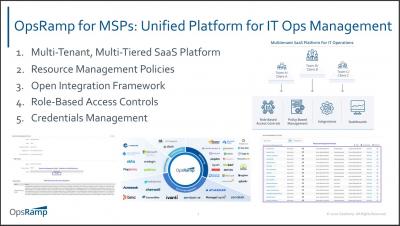
Why MSPs Choose OpsRamp for Hybrid IT Operations Management
OpsRamp’s recent survey found that 91% of IT operations teams were looking to increase spending with managed service providers (MSPs). The major reasons for working with MSPs to monitor and manage hybrid infrastructure were technical expertise (63%), security know-how (52%), and cost optimization (50%). A modern IT operations management (ITOM) platform can help MSPs tame infrastructure complexity by monitoring legacy and modern environments, deliver the right operational context to better understand the impact of infrastructure on the health of IT services, use machine learning techniques to improve critical operational metrics, and handle customer requirements for compliance with secure access to hybrid and cloud IT infrastructure. In this Tech Talk, we'll review key OpsRamp platform technology that enables service providers to accelerate digital transformation for their customers.