Embracing context propagation
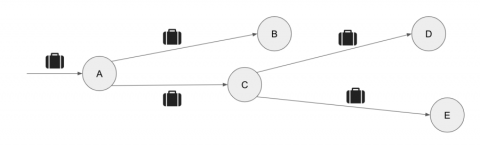
This post illustrates some practical examples of distributed context propagation. More detailed examples are presented in Chapter 10 of my book, Mastering Distributed Tracing.


The latest News and Information on Distributed Tracing and related technologies.
This post illustrates some practical examples of distributed context propagation. More detailed examples are presented in Chapter 10 of my book, Mastering Distributed Tracing.
Recently, Toshok was telling a story about the kind of thing he talks about a lot—improving the performance of some endpoint or page or other. Obviously, we spend a lot of time thinking about how to improve the experience of our users, but what caught my attention this time was that what he was describing sounded like a new kind of testing in production—so I asked him to go into a bit more detail.
In this article we will demonstrate some of the tracing features of the MicroProfile-OpenTracing project while evaluating performance of new Java runtime Quarkus. You will also learn how a Java application can be compiled to native code for supersonic performance!
The performance of any application is measured by its availability and responsiveness. When an application is slow, IT operations staff must troubleshoot the cause of slowness, identify it and resolve it. While application performance problems may be caused by issues in the supporting infrastructure, often the issues are related to the application components themselves.
Jaeger was built from day 1 to be able to ingest huge amounts of data in a resilient way. To better utilize resources that might cause delays, such as storage or network communications, Jaeger buffers and batches data. When more spans are generated than Jaeger is able to safely process, spans might get dropped. However, the defaults might not fit all scenarios: for instance, agents running as a sidecar might have more memory constraints than agents running as a daemon in bare metal.
A few weeks ago, BubbleUp came out of Beta. We’ve been getting fantastic user feedback on how BubbleUp helps users speed through the Core Analysis Loop and lets people find things they never could have found before. We’ve also been learning more about how BubbleUp works with Tracing, which unearthed some difficult issues. Today, we’re taking those head on.
Since its release in 1995, PHP has been one of the most popular server-side languages for building web applications. It supports a wide range of web servers, databases, and operating systems. PHP developers use popular frameworks like Laravel, Symfony, and Zend to deploy and manage sites that serve high volumes of traffic. To help you monitor PHP performance, identify bottlenecks, and optimize your users’ experience, we’re pleased to announce APM & distributed tracing for PHP.
If you are familiar with instrumenting applications, you may have heard of OpenMetrics, OpenTracing, and OpenCensus. These projects aim to create standards for application performance monitoring and collecting metric data. Although the projects do overlap in terms of their goals, they each take a different approach to observability and instrumentation.