Operations | Monitoring | ITSM | DevOps | Cloud
August 2022
Splunk APM Expands Code Profiling Capabilities with Several New GAs
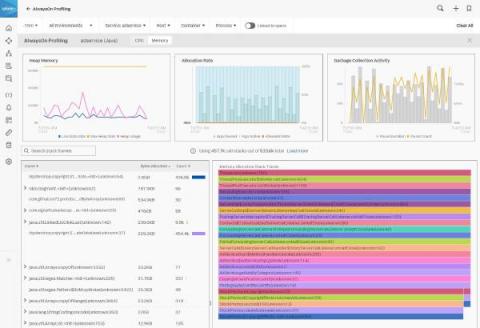
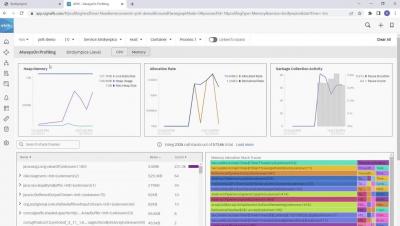
We’re excited to share new Splunk capabilities to help measure how code performance impacts your services. Splunk APM’s AlwaysOn Profiling now supports.NET and Node.js applications for CPU profiling, and Java applications for memory profiling. AlwaysOn Profiling gives app developers and service owners code level visibility into resource bottlenecks by continuously profiling service performance, at minimal overhead.
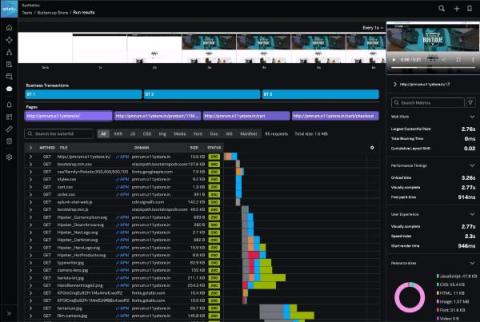
Splunk Synthetic Monitoring in Splunk Observability Cloud - Product Demo
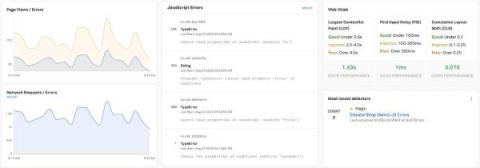
Using Splunk Observability Cloud to Monitor Splunk RUM
As a principal engineer on the Splunk Real User Monitoring (RUM) team who is responsible for measuring and monitoring our service-level agreements (SLAs) and service-level objectives (SLOs), I depend on observability to measure, visualize and troubleshoot our services. Our key SLA is to guarantee that our services are available and accessible 99.9% of the time.
Snowflake DB: Observing a Snowflake From Cloud to Chart
You’ve probably heard something like this before: “It’s a managed service! We don’t need to worry about anything!” But when it comes to your production workloads, database monitoring is imperative. With the new Snowflake Dashboards and Detectors in the Splunk Observability Content Contributors repository you can start seeing the details of individual Snowflakes.
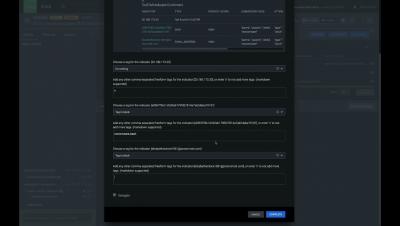
Simplify Cloud Data Onboarding with the NEW Data Manager
IT Salaries: Trends, Roles, & Locations for 2022-2023
IT roles have never been more in demand and IT salaries have never been higher, according to recent reports and data sources. Whether you are hiring, looking for a career change, or simply work in tech, it’s important to stay up-to-date on the state of employment in the industry. This blog post will review, roundup, and summarize some of the latest trends for IT salaries and demand by role and location (among other variables) to help you get a clear view of the landscape.
Memory Profiling for Java Applications, a Splunk APM Product Walkthrough
How Cloud Network Monitoring Is Critical To Business Success
A rising number of businesses are adopting and utilizing cloud services and capabilities with remarkable success. But embracing cloud tools and services often brings unexpected changes for business leaders and IT teams, especially because of the way in which cloud adoption has altered how networks are monitored and managed.
To Observability and Back Again: A Context's Journey
How do you pass context from events that concern Security teams to Development teams who can make changes and address those events? Often this involves a series of meetings and discussion that can take days or weeks to filter down from security event to developer awareness. Compounding the problem, developers generally do not have access to Splunk Core, Cloud or Enterprise indexes used by security teams, and indeed, may use only Splunk Observability for their metrics, traces and even logs.
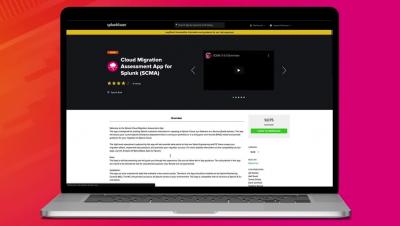
Splunk Cloud Migration Made Easy with Splunk Cloud Migration Assessment App
Data Observability Explained: How Observability Improves Data Workflows
Organizations in every industry are becoming increasingly dependent upon data to drive more efficient business processes and a better user experience. As the data collection and preparation processes that support these initiatives grow more complex, the likelihood of failures, performance bottlenecks, and quality issues within data workflows also increases.
Splunk Snags Six 'Best of' Awards From Customer Reviews on TrustRadius
Splunk is honored to be the recipient of a series of six new awards from TrustRadius—all based on customer reviews. In this round, TrustRadius grants its “Best of” Awards to the top three products per Best Feature Set, Best Value for Price and Best Relationship in each respective category.
Data Insider: What is Distributed Tracing?
Introducing Splunk Operator for Kubernetes 2.0
The Splunk Operator for Kubernetes team is extremely pleased to announce the release of version 2.0! This represents the culmination of many months of work by our team and continues to deliver on our commitment to provide a high-quality experience for our customers wishing to deploy Splunk on the Kubernetes platform.
Announcing the General Availability of Synthetic Monitoring Within Splunk Observability
Today we’re proud to announce the general availability of best-in-class Synthetic Monitoring capabilities within Splunk Observability Cloud. Now, IT and engineering teams can proactively measure, monitor and troubleshoot their critical user flows, APIs and services, connected across Splunk Observability.
Postcard From .conf22: Customers Inspire Our Latest Release
They say, “What happens in Vegas, stays in Vegas,” but I wanted to highlight the role our customers played at last month’s.conf22, our annual users’ event at the MGM Grand. It was awesome meeting customers in person again, and connecting virtually with thousands more. We had a terrific turnout with 8,200+ customers and partners representing 113 countries and more than 6,500 organizations.


