Operations | Monitoring | ITSM | DevOps | Cloud

March 2021

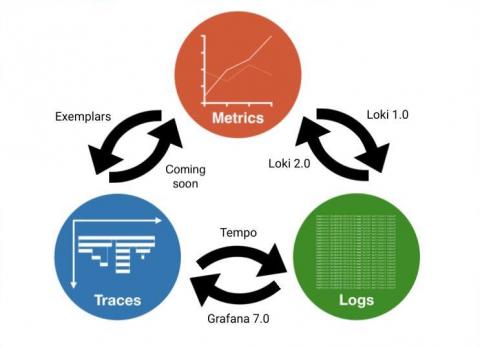
Intro to exemplars, which enable Grafana Tempo's distributed tracing at massive scale

Exemplars are a hot topic in observability recently, and for good reason. Similarly to how Prometheus disrupted the cost structure of storing metrics at scale beginning in 2012 and for real in 2015, and how Grafana Loki disrupted the cost structure of storing logs at scale in 2018, exemplars are doing the same to traces. To understand why, let’s look at both the history of observability in the cloud native ecosystem, and what optimizations exemplars enable.

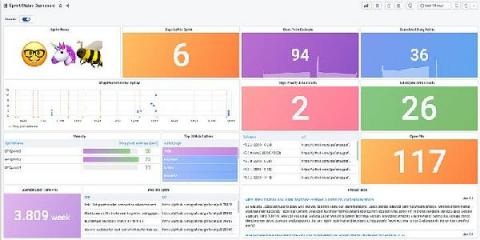
Want to visualize software development insights with Grafana? With our new Jira Enterprise plugin, you can!

A very fun part of my job as a Solutions Engineer at Grafana Labs is getting to learn the ins and outs of a new feature or play with a plugin while it is still in development. So, when I heard murmurs that our latest Enterprise plugin would be an integration with Jira, I felt the forsaken call of the agile sirens luring me back to my days when I worked as a technical writer on a product team.

How we're graduating Grafana Agent experiments into the official Prometheus project

We’ve been experimenting with new ways to use and operate Prometheus over the past year. Every successful Grafana Agent experiment turns into an upstream contribution for the whole Prometheus community to benefit from. In this blog post, I go over the history of the Agent’s successful — and not so successful — experiments.

Grafana 7.5 released: Loki alerting and label browser for logs, next-generation pie chart, and more!

Grafana v7.5 has been released! This is the last stable release before we launch Grafana 8.0 at GrafanaCONline in June. Register for free now, so you won’t miss the great sessions we’re planning around all things Grafana. And if you’re doing something special with Grafana that you’d like to share with the community, the CFP for GrafanaCONline is open until 06:59 UTC on April 10! Now, back to 7.5.

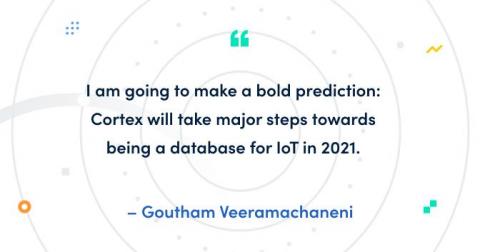
2021: The year of Cortex for IoT?

My Grafana Labs colleague RichiH recently talked about why IoT and time series databases work so well together. It just so happens that we have a highly scalable time series database on hand. Let’s talk about that. My name is Goutham, and I am a maintainer for Cortex. I have been working on it for nearly three years out of the four-and-a-half years the project has existed. Cortex is built to serve as a scalable, long-term store for Prometheus.

How I fell in love with logs thanks to Grafana Loki

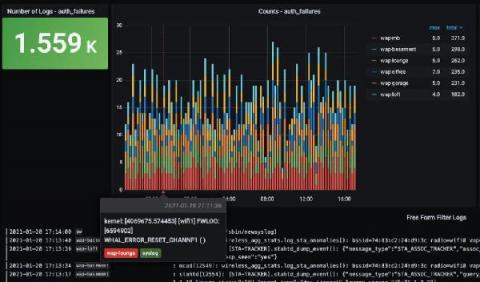
As part of my job as a Senior Solutions Engineer here at Grafana Labs, I tend to pretty easily find ways out of technical troubles. However, I was recently having some Wi-Fi issues at home and needed to do some troubleshooting. My experience changed my whole opinion on logs, and I wanted to share my story in hopes that I could open up some other people’s eyes as well. (I originally posted a version of this story on my personal blog in January.) First, some background info.

What's new in Grafana Cloud for March 2021: improvements to alerting, synthetic monitoring, and more

As the product manager for Grafana Cloud, I am constantly following the progress of all the new features that our engineering teams are working on, from early ideation to release. We’re always excited to share updates with the community, so you can all try them out and let us know what you think. So each month, I’ll be rounding up the latest Grafana Cloud features and improvements on the blog.

Why implementing Grafana Enterprise was a bright idea for U.K. energy supplier Utilita

Energy efficiency is a term often used to describe appliances or light bulbs. But when it comes to business, making sure your sales team — and customers — are being efficient with their personal energy is a big key to success. That was a major lesson learned by Utilita, the U.K.’s first and only specialist Smart Pay As You Go Energy supplier.

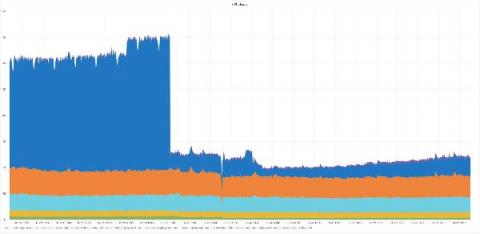
What's new in Grafana Enterprise Metrics for scaling Prometheus: enhanced access control and a compactor that supports 650 million active series and beyond

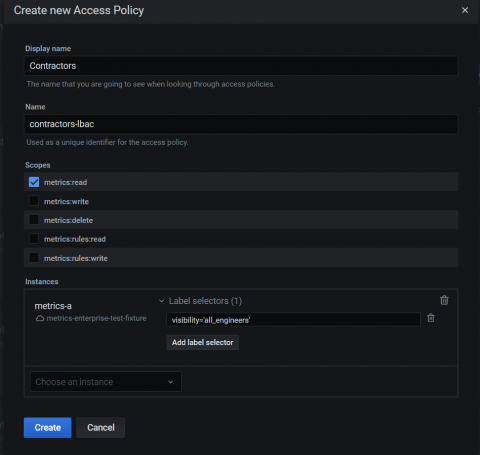
I’m a fresh starter here at Grafana Labs, leading one of our teams working on the Grafana Enterprise Stack. As a longtime user of Grafana, I couldn’t wait to see what’s new in versions 1.1 and 1.2 of Grafana Enterprise Metrics (GEM), our scalable, self-hosted Prometheus service. I tried out the shiny features and wanted to share some of the cool things I found.

Grafana Loki 2.2 released: Multi-line logs, crash resiliency, and performance improvements

I imagine everyone is long since tired and bored with their Loki 2.1 end of year/holiday gift, so I’m here today to bring some really exciting news. Loki 2.2 is released!!! New to Loki? Want a refresher? Owen Diehl and I did a webinar not long ago. Check out the on-demand video for a good overview of what Loki is capable of in 2021! Lots of new features are in this release, but worth celebrating in particular is that the single most requested feature for Loki has been added!

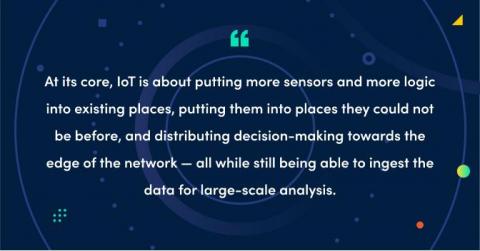
The basics of IoT, and why Prometheus works so well with it

Before we start, please take a moment to appreciate what day it is. IoT, or Internet of Things, has been a buzzword for longer than usual. Buzzwords usually have two common properties, and then their paths fork. I like thinking about buzzwords and about the useful aspects of what they mean. The most recent public example focuses on another buzzword currently in its hype phase: observability.

A closer look at the admin API and plugin for centralized tenant adminstration and control in Grafana Enterprise Logs

To follow up on our introduction of Grafana Enterprise Logs, the latest addition to the Grafana Enterprise Stack, let’s dig into one of the key features: the admin API and admin plugin. Grafana Loki, Grafana Labs’ log aggregation project, provides the underpinnings of Grafana Enterprise Logs (GEL).

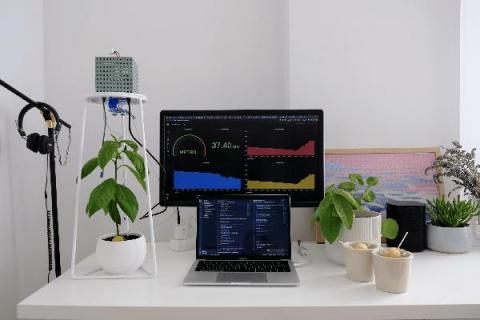
How I built a monitoring system for my avocado plant with Arduino and Grafana Cloud

A couple months ago, during our Grafana hack days, I created my first monitoring solution: my sourdough monitoring system. It was a lot of fun to build it, and I enjoyed it a lot! So when the next Grafana hack day was approaching, I started to wonder what my next monitoring system could be. What would I like to learn more about? What would I like to get better at doing? To be honest, I didn’t have to think hard.

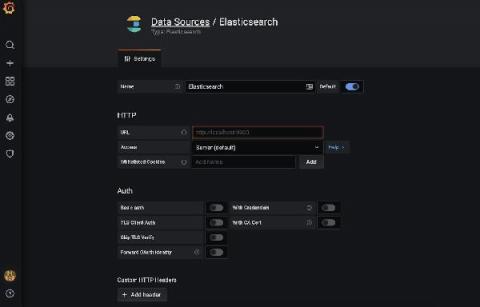
Why we're partnering with Elastic to build the Elasticsearch plugin for Grafana

As I’ve often talked about before, we have a “big tent” philosophy at Grafana Labs. We believe our users should determine their own observability strategy and choose their own tools; Grafana allows them to bring together and understand all their data, no matter where it lives. In practice, that means that we want to support data sources that our users are passionate about.

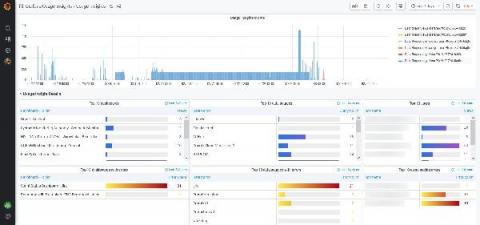
New in Grafana 7.4: Export usage data to Loki to help manage dashboard sprawl and troubleshoot faster

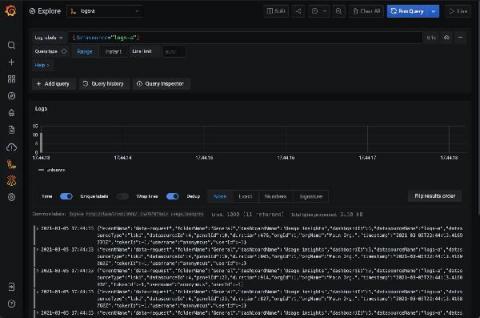
We first released the usage insights Enterprise feature in Grafana 7.0 based on feedback from customers that they would like to better understand how their users are interacting with Grafana, including the dashboards they visit, the information they query, and where they run into issues. What we learned was that dashboard sprawl is a real issue: Administrators estimate that almost 60% of dashboards might not be used at all.

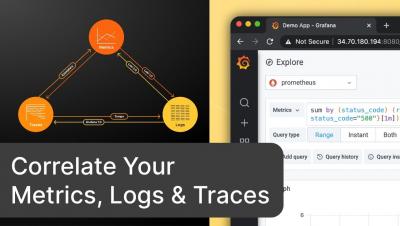
Correlate Your Metrics, Logs & Traces with the curated OSS observability stack from Grafana Labs

Correlation between metrics, logs, and traces should be as effortless as possible. This helps you make better decisions and actions. The Grafana Labs open-source observability stack enables powerful correlations between your metrics, log, and traces. The key here is to have consistent metadata across the three pillars of observability. Let me demo you how this works in this video.