Operations | Monitoring | ITSM | DevOps | Cloud
Latest News
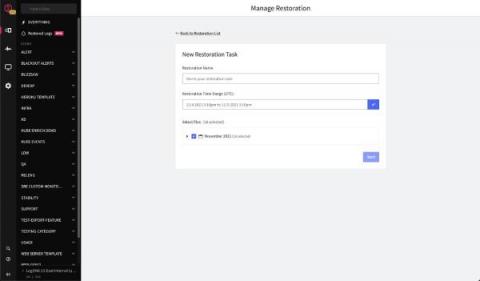
Introducing Log Data Restoration on LogDNA
If you’re reading this, I’m pretty sure I don’t need to do much to convince you of the importance of logs. They are the core atomic unit for understanding your environments and provide the insights required to troubleshoot, debug, and more. The fact of the matter is that everyone in your organization needs logs to perform critical functions of their job.
Anodot Acquires Pileus to Transform the Cloud Cost Optimization Space
We couldn’t be more excited here at Anodot at the announcement of the acquisition of Pileus. Acquiring a company is a very special event, a moment that is the culmination of months of thought and deliberation. Is there a strong synergy between the two entities? Do we share the same DNA and culture? Is the additional product aligned with our long-term vision?
Your Ops and DevOps teams need to work together, and fast. Who you gonna call?
The world is moving fast, led by an ever-accelerating IT landscape. In recent years, two distinct types of teams have emerged that assist in driving this business transformation: DevOps/SRE teams that are in charge of driving rapid innovation of products and services, and IT Ops/NOC teams that focus on preventing outages and maintaining the high level of quality, reliability and serviceability that modern, discerning customers expect.
Icinga for Windows Releasing v1.7.0 - Start your contribution
Today we are happy to announce, that Icinga for Windows v1.7.0 has been released! While this release includes lots of bugfixes for the Framework itself including the basic plugins, our main goal was to increase usability and make access for developers a lot easier.
SL1 Duomo Release: Fueling Your Flight to AIOps with Workflow Automations
Introducing SL1 Duomo. Designed to turbocharge your digital transformation journey to business growth—with the final destination of automated operations.
Goliath Technologies Announces Enhancements to Goliath Performance Monitor
Philadelphia – November 9, 2021 – Goliath Technologies, a leader in end-user experience monitoring and troubleshooting software for hybrid cloud environments, announced today the release of Goliath Performance Monitor 11.9.2. New features include a Citrix NetScaler Module and industry-only VMware Horizon End-User Experience Scorecard.
ObservabilityCON 2021: Your guide to the newest announcements from Grafana Labs
This morning during the ObservabilityCON keynote, we announced some of the exciting projects and feature enhancements we’ve been working on for our customers and community. And it doesn’t end there. Throughout the week, we’ll continue to unveil new features, go deeper with live demos, and share our plans to shape the future of observability. With so many new announcements and features to check out, we want to make sure you know where to get more details about these developments.
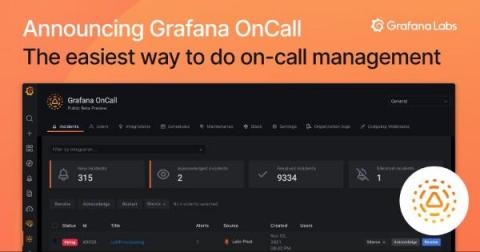
Announcing Grafana OnCall, the easiest way to do on-call management
A critical part of managing modern software development is setting up and running an on-call rotation. But that often involves significant toil, in part because many of the existing tools are cumbersome and not developer-friendly. That’s why we’re excited to announce Grafana OnCall, an easy-to-use on-call management tool that will help reduce toil in on-call management through simpler workflows and interfaces tailored for devs.
Introducing Grafana Enterprise Traces, joining metrics and logs in the Grafana Enterprise Stack observability solution
Today, we are launching a new Grafana Labs product, Grafana Enterprise Traces. Powered by Grafana Tempo, our open source distributed tracing backend,.and built by the maintainers of the project, this offering is an exciting addition to our growing self-managed observability stack tailored for enterprises.


