Operations | Monitoring | ITSM | DevOps | Cloud

Latest News

New release: Incident Automation just got even better with conditions in FireHydrant Runbooks

The ability to automate your incident response process means you can start responding to incidents faster. So it’s easy to see why FireHydrant Runbooks is so popular within the platform. When you let automation take over, you can spend more focus fixing problems and keeping your customers happy. Now with the addition of conditions, you can create even more powerful automation.

Refreshing PagerDuty's Navigation for Increased Efficiency and Simplification

We are super excited to share that we are currently testing and in the process of rolling out a new desktop global navigation to all of our users. Things that are clear in retrospect often emerge from ambiguous and humble beginnings. Initially built as a simple on-call management tool for IT responders, PagerDuty has evolved into an end-to-end, enterprise-grade digital operations platform.

InfluxDB 2.0 Release Candidate Now Available

Today we announce InfluxDB 2.0 Open Source’s first official release candidate (RC). This represents a final version of the software as we move towards general availability. We appreciate all the feedback from our users over the last few years and realize that getting to this stage has taken longer than any of us predicted.

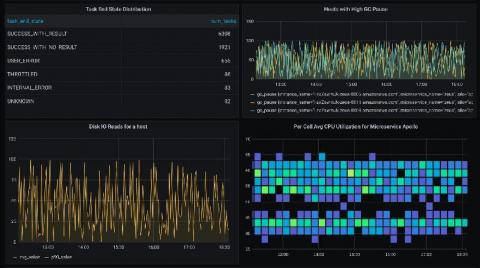
Now you can add Amazon Timestream to your Grafana observability dashboard

Today, AWS launched Amazon Timestream, a fast, scalable, serverless time series database purpose-built for IoT use cases. If you’re looking into trying out Timestream, know that you can visualize the native Timestream queries with Grafana out of the box. Here are some examples of the robust, SQL-style Timestream queries visualized in Grafana.

Introducing Puppet Enterprise tasks and workflows in Puppet Remediate

Today we are pleased to announce the release of Puppet Remediate 1.4. This release brings together the dynamic vulnerability data and prioritization capabilities in Puppet Remediate with Puppet Enterprise’s industry-leading automation to help organizations improve their security posture and reduce the risk of security incidents.

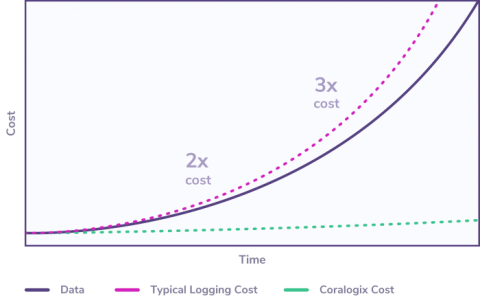
Announcing Streama: Get complete monitoring coverage without paying for the noise

With the new Streama capability announced today, you no longer have to choose what to monitor and what to drop to manage your logging costs. For years, our customers have enjoyed the benefits of a log analytics platform that enables them to autonomously manage and analyze data in their cloud applications. Our machine learning engine empowers users to improve their system stability and accelerate their release cycles.

Now in Beta: SLA Monitor by StatusGator

StatusGator has been monitoring hundreds of status pages for more than 5 years. During this time, we’ve collected millions of data points about the status of the cloud: What went down, how long it was down, messages about why, and more. As StatusGator grows, we’re working on ways to incorporate this archival data into StatusGator for various uses. One common use: holding vendors accountable to Service Level Agreements. Introducing: SLA Monitor by StatusGator.

New Microsoft partnership embeds Datadog natively in the Azure portal

We are excited to announce a new partnership with Microsoft Azure, which has enabled us to build streamlined experiences for purchasing, configuring, and managing Datadog directly inside the Azure portal. This first-of-its-kind integration of a third-party service into a public cloud provider reduces the learning curve for using Datadog to monitor the health and performance of your applications in Azure—and sets you up for a successful cloud migration or modernization.

Gain actionable insights with XHR-level detail for response codes

A broken or poor performing XHR can significantly impact a user’s experience with a page by slowing down the load time or causing it to break entirely. Many of our customers monitoring web applications agree that monitoring and optimizing XHR calls is the biggest lever they have to improve application performance. In April of this year, we announced that Raygun Real User Monitoring can now surface analytics into the response codes from XHR calls.