Operations | Monitoring | ITSM | DevOps | Cloud

Latest News

Sponsored Post

Validating your IT environment, discovering browser extensions & more with EventSentry v4.2

This latest update to EventSentry improves your security posture with validation scripts, simplifies IT troubleshooting for both administrators and users, gives you visibility into installed browser extensions along with many other usability improvements in the web reports.

OpManager MSP: ManageEngine's new MSP focused network monitoring solution

Are you a managed service provider (MSP) who monitors the networks of multiple customers from a central location? ManageEngine launches OpManager MSP, tailored for MSPs with customer-centered network monitoring and seamless management of different customer networks over multiple locations.

ServiceNow global survey shows how COVID-19 is changing work

Today ServiceNow released The Work Survey, a comprehensive global view on how COVID-19 is changing work and the opportunities ahead for a wave of digital innovation in how people work and businesses operate. Executives and employees surveyed in 11 countries across multiple industries agree: technology enabled them to pivot to new ways working faster than thought possible, and digital transformation will accelerate innovation.

How Our Latest Release Makes Your PagerDuty Experience Frictionless

In a world that’s always on, keeping services up and running isn’t just ideal—it’s mission-critical for all of PagerDuty’s customers. It’s not lost on us that serving as the central nervous system for digital operations at some of the world’s largest companies is no small job.

Quick and Easy Way to Implement Kubernetes Logging

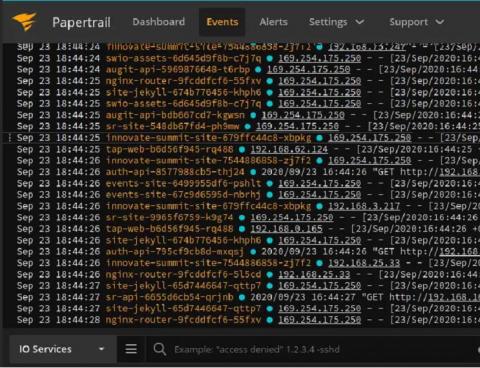
The SolarWinds® Papertrail™ team is excited to announce SolarWinds rKubeLog, an open-source project designed to streamline Kubernetes logging. rKubeLog allows you to forward logs to Papertrail from within a Kubernetes cluster without using a daemon or setting up application-level logging or a logging sidecar. rKubeLog is a quick and easy way to implement logging for applications running in Kubernetes clusters.

Launching AppSignal Monitoring for Node.js 1.0

Do you know how many errors your Node.js application had last week? How many users were affected? Which servers were high on CPU/Memory/Disk? If you do know, how many different tools did you have to install, and how many hours you’ve spent configuring all those tools? AppSignal is here to change the way you monitor your apps and simplify your life as a developer. Today, we officially launch the 1.0 version of @appsignal/node.js.

Watchdog surfaces root cause insights and Kubernetes anomalies

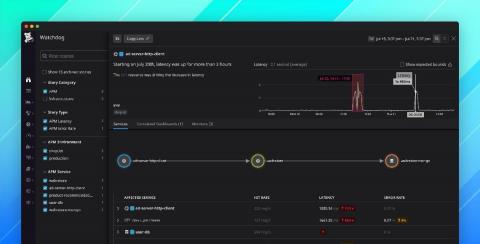
Since 2018, Watchdog has provided automatic anomaly detection to notify you of performance issues in your applications. Earlier this year, we introduced Watchdog for Infra, enhancing Watchdog to also monitor your infrastructure. We’re pleased to announce the latest enhancements to Watchdog, which now provides more visibility and greater context around the full scope of each application issue.

Six-peat! Once Again, IDC Ranks Splunk #1 in ITOA Market Share

We just got some great news. IDC has ranked Splunk #1 for both market share and market revenue in their IDC Worldwide IT Operations Analytics Software Market Shares, 2019 report. This is the sixth year in a row IDC has ranked Splunk as #1 in ITOA. While we’re proud of this recognition, let me say right away that our success is due to the continued success of our customers, and we’re very grateful for the opportunity to be a part of it.

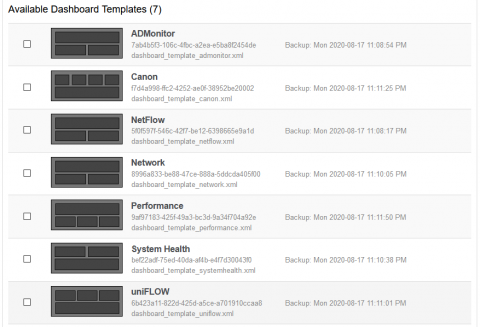
Introducing the InfluxDB Template UI: Monitoring Made Simple

At InfluxData, we’re obsessed with time to awesome — how quickly can you start working productively with time series data? What can we do to make things better? InfluxDB Templates are a great example of this mindset. Back in April, we announced Templates as a way to package up everything you need to monitor a particular technology — Telegraf configurations and InfluxDB Dashboards, Tasks, Alerts, and related artifacts — into a single configuration file.

Now GA: Cortex blocks storage for running Prometheus at scale with reduced operational complexity

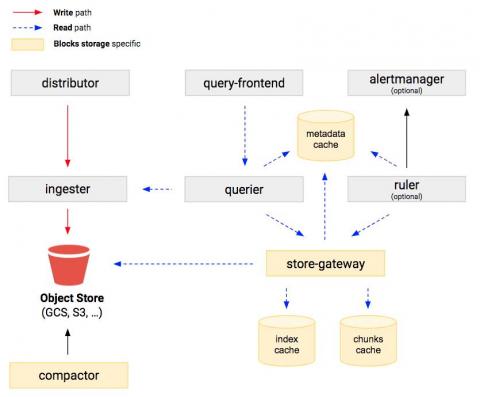
We’ve just launched Cortex 1.4.0, one of the most significant releases of 2020. The big headline: The new blocks storage engine has exited the experimental phase and is now marked as Generally Available. Blocks storage aims to reduce the operational complexity and costs of running a Cortex cluster at scale. In particular, it removes the dependency from a NoSQL database to store series indexes.