Operations | Monitoring | ITSM | DevOps | Cloud

Latest Posts

Kubernetes Simplified: Understanding its Inner Workings

Kubernetes has revolutionized the world of container orchestration, providing organizations with a powerful solution for deploying, managing, and scaling applications. However, the complexity of Kubernetes can be daunting for newcomers. In this blog, we will demystify Kubernetes by breaking down its core components, revealing its operational principles, and guiding you through the process of running a pod.

AWS CloudTrail vs CloudWatch: Features & Instructions

In today’s digital world, cloud computing is necessary for businesses of all types and sizes, and Amazon Web Services (AWS) is undoubtedly the most popular cloud computing service provider. AWS provides a vast array of services, including CloudWatch and CloudTrail, that can monitor and log events in AWS resources. This article will compare AWS CloudWatch and CloudTrail, looking at their features, use cases, and technical considerations.

Getting started with Squadcast's On-Call Scheduling

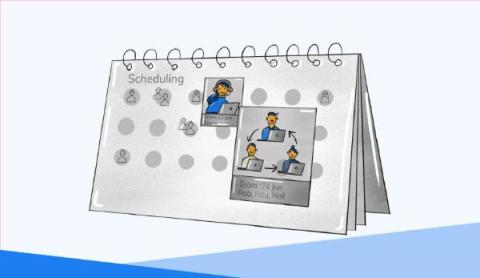
We understand that everyone values a simple and straightforward approach when it comes to setting up schedules. We at Squadcast are fully aware of the difficulties involved in creating an on-call schedule from scratch or migrating it to a new platform. Hence we have come up with a blog to assist you in seamlessly setting up your on-call schedule using Squadcast. Our goal is to provide guidance and support to make the process as effortless as possible for you.

Prometheus Blackbox Exporter: Guide & Tutorial

Prometheus is a favored open-source monitoring system that collects, stores, and queries metrics from various sources. In Prometheus, an exporter is a component that collects and exposes metrics in a format Prometheus can scrape. The Prometheus Blackbox Exporter is designed to monitor “black box” systems with internal workings that are not accessible by Prometheus. It sends HTTP, TCP, and ICMP requests to the external systems and measures their response times and statuses.
Sponsored Post

Prometheus Sample Alert Rules

Prometheus is a robust monitoring and alerting system widely used in cloud-native and Kubernetes environments. One of the critical features of Prometheus is its ability to create and trigger alerts based on metrics it collects from various sources. Additionally, you can analyze and filter the metrics to develop: In this article, we look at Prometheus alert rules in detail. We cover alert template fields, the proper syntax for writing a rule, and several Prometheus sample alert rules you can use as is. Additionally, we also cover some challenges and best practices in Prometheus alert rule management and response.

Sponsored Post

Scaling Site Reliability Engineering Teams the Right Way

Most SRE teams eventually reach a point in their existence where they appear unable to meet all the demands placed upon them. This is when these teams may need to scale. However, it's important to understand that increasing team capacity is not the same as increasing the number of people on the team. Let's unpack what scaling a team is all about, what are the indicators, what are steps you can take, and how you know if you're done.

Install Prometheus on Kubernetes: Tutorial & Examples

As one of the most popular open-source Kubernetes monitoring solutions, Prometheus leverages a multidimensional data model of time-stamped metric data and labels. The platform uses a pull-based architecture to collect metrics from various targets. It stores the metrics in a time-series database and provides the powerful PromQL query language for efficient analysis and data visualization.

Incident Response Guide

Site reliability engineering (SRE) is a critical discipline that focuses on ensuring the continuous availability and performance of modern systems and applications. One of the most vital aspects of SRE is incident response, a structured process for identifying, assessing, and resolving system incidents that can lead to downtime, revenue loss, and brand reputation damage.

Squadcast + HaloPSA Integration: Enabling Streamlined Incident Response & Alerting

HaloPSA is a modern and intuitive all-in-one professional services automation (PSA) solution, designed for service providers. HaloPSA’s cloud platform helps you manage your entire business, modernize customer experience and automate your service. If you use HaloPSA for PSA requirements, you can integrate it with Squadcast, an end-to-end Incident Response and Reliability Workflow platform, to route detailed alerts from HaloPSA to the right users in Squadcast.

The Guide to SRE Principles

Site reliability engineering (SRE) is a discipline in which automated software systems are built to manage the development operations (DevOps) of a product or service. In other words, SRE automates the functions of an operations team via software systems. The main purpose of SRE is to encourage the deployment and proper maintenance of large-scale systems.