Operations | Monitoring | ITSM | DevOps | Cloud

Latest Posts

There Is Only One Key Difference Between Observability 1.0 and 2.0

We’ve been talking about observability 2.0 a lot lately; what it means for telemetry and instrumentation, its practices and sociotechnical implications, and the dramatically different shape of its cost model. With all of these details swimming about, I’m afraid we’re already starting to lose sight of what matters.

Improve Your Shopify User Experience with Real User Monitoring

In the modern world of e-commerce, customer expectations are sky-high: online shoppers are used to seamless user experiences, even with massive online retailers operating at scales that were previously unthinkable. Services like Shopify provide accessible modern storefronts and payment processes, reducing the need for significant backend work to get an online store up and running.

What's New with Kentik AI: Enhanced Journeys for Cloud Observability, DDoS, Peering, and Faster Network Insights

Kentik Journeys is an AI-powered user experience that helps you investigate your network. It combines knowledge about your network with deep GenAI integration to help you answer network questions and solve problems faster than ever. Since launch, we’ve been innovating on Journeys’ capabilities and skills with customer feedback. Here’s a peek at what’s new.

Canonical provides the ideal platform for Microsoft Azure IoT Operations

London, 19 November 2024. Canonical has collaborated with Microsoft as an early adopter partner and tested Microsoft Azure IoT Operations on Ubuntu Core and Kubernetes, which is notable as Microsoft today released Azure IoT Operations, a unified data plane providing significant improvements in node data capture, edge-based telemetry processing and cloud-ingress.

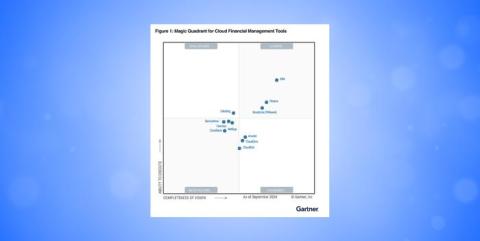
Anodot achieves "Visionary" Status in Gartner's Magic Quadrant for Cloud Financial Management Tool

Here’s how Anodot became a leader in the Visionary category with its game-changing vision in FinOps and cloud-saving insights. It wasn’t just recognition from the leading authority in the technology industry but the culmination of a journey fueled by our incredible team’s dedication to providing our customers with FinOps-centric innovation and AI proprietary data. This wasn’t just any victory but an acclaimed win forged by industry-led expert leaders at our company.

Building an economy on sustainability and innovation: the scale-up solution

Economically speaking, scale-ups deliver far greater value than their size suggests. Whilst they make up just 1% of SME firms, the ‘sub-sector’ accounts for 8% of SME employment and 22% of SME turnover. Nearly 1 million people are employed in scale-up companies and these businesses have a combined turnover of almost £500 billion. Scotland has just over 2,100 scale-ups, with a pipeline of another 1,000. The current turnover of these organisations totals just over £41bn.

CloudWatch metrics exporter YACE is now a Prometheus community project

We’re thrilled to share that the open source Yet Another CloudWatch Exporter (YACE) is now a prometheus-community project! This move represents an exciting milestone in YACE’s journey and validates the project’s contribution to the Prometheus ecosystem. Yace was started in 2018 by Thomas Peitz, who has overseen the dramatic evolution of the CloudWatch metrics exporter ever since.

What is a Log File? Types Explained with Examples

If you’ve ever spent hours trying to figure out what went wrong in your code, you know how frustrating it can be without a clear trail to follow. Logs give you that trail, showing the steps your system took before something broke. Think of stack traces, they’re helpful for showing you where an error occurred. But they don’t always explain how it occurred. That’s where logs come into place.