Operations | Monitoring | ITSM | DevOps | Cloud

Latest Posts

Monitoring Telegraf Plugins in Your Architecture

Monitoring Telegraf — the open source, plugin-driven server agent for collecting metrics from stacks, sensors and systems — is important because it allows you to track the health of Telegraf plugins in your stack. It’s for this purpose that the Telegraf Monitoring Template was developed. Before introducing the template, it’s helpful to recall how Telegraf works.

Key Kubernetes audit logs for monitoring cluster security

Kubernetes continues to be a popular platform for deploying containerized applications, but securing Kubernetes environments as you scale up is challenging. Each new container increases your application’s attack surface, or the number of potential entry points for unauthorized access. Without complete visibility into every managed container and application request, you can easily overlook gaps in your application’s security as well as malicious activity.

Automated IT Software and Customer Services: The Key to Today's UX

Service experience is more important than the service itself! Successful service experience goes beyond simply delivering the right business outcome. As your user base has all sorts of individuals, it is necessary to make sure that your solution is the perfect fit for all of them. It should satisfy their professional needs in the best possible way and also deliver a service experience that meets the contextual needs and professional expectations of the end-user.

Top Observability tools for DevOps Engineers and SREs

Better visibility is the first step to improved system stability. Our latest blog outlines Top Observability tools for DevOps Engineers & SREs to help you get started on your journey to gain valuable insights into your infrastructure. “We can't fix something which we can't observe” - whether it's a steam engine or a complex microservice based cloud deployment, great observability makes troubleshooting things easier.

How To Detect and Prevent Memory Leaks

A memory leak in an application deployed on the cloud can affect the availability and reliability of the application. Therefore, it is highly important to identify and ultimately resolve it quickly. However, in the production environment running on the cloud, memory leak detection is a challenge without the knowledge of the application or its internal object allocation details.

Avoiding Common Internationalization Mistakes

Languages are complicated, and every language is complicated in different ways that can be hard to understand without learning every single one of them. Some languages form words from multiple characters while others have symbols that represent entire concepts. Some feature words without pluralization or gender and rely on context for that while others have two or even more genders for words. Some are very phonetic while others pronounce words seemingly at random (cough English, though cough).

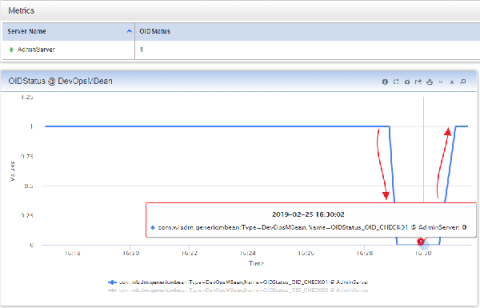
How to Monitor OID Status and Restart the LDAP Service When OID is Down?

We prepared WLSDM OID DevOps MBean blog about when OID shuts down due to external problems such as a network issue, the system will be provided to stand up. First of all, We are going to create WLSDM DevOps MBean then assign restart script on it. If the dummy LDAP search on DevOps MBean does not return any result, the opmnctl service will be restart by triggering the action script.

5 Common Elasticsearch Mistakes That Lead to Data Breaches

Avon and Family Tree aren’t companies you would normally associate with cybersecurity, but this year, all three were on the wrong side of it when they suffered massive data breaches. At Avon 19 million records were leaked, and Family Tree had 25GB of data compromised. What do they have in common? All of them were using Elasticsearch databases. These are just the latest in a string of high profile breaches that have made Elasticsearch notorious in cybersecurity.