Operations | Monitoring | ITSM | DevOps | Cloud

Latest Posts

New integration with Uber for Business gets employees safely moving again

I miss being in a car. I really miss having someplace to go! But I’m also glad that when it’s safe to go back to our offices, I’ll have the option of commuting with Uber for Business, right from my ServiceNow Safe Workplace suite. We launched the ServiceNow Safe Workplace suite two months ago. It includes apps that help companies prepare for and facilitate a safe and effective return to their respective workplaces.

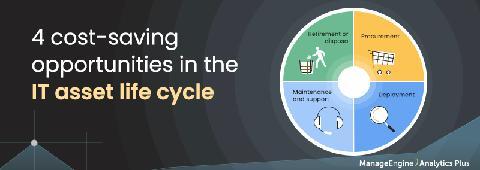
Hardware Asset Management: Knowing When to Upgrade

When is it time to say goodbye? For a hardware device, that question can be tough to answer. Though the device has been in the environment for several years, there is still usable life left. So why would we retire and dispose the device and spend additional money on a replacement? With the device’s lifecycle information, that answer becomes much clearer.

Many-to-Many Communication: The Next Generation of Deterrence

Military strategists will often tell you that the best way to win a conflict is to prevent it by projecting an unmistakable posture of strength, preparedness and resolve. As history has shown in the seven decades since the Second World War, deterrence doesn’t come cheap, certainly not in the era of modern, technology-enabled warfare. Yet it is still far less costly in lives, dollars, and equipment than letting a hostile situation escalate out of hand.

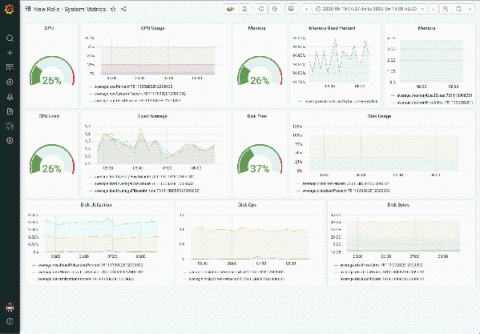
A conversation about Grafana Labs' new partnership with New Relic

In helping users unify and contextualize all their observability data, Grafana is completely database-agnostic. “We believe that organizations get the best view of what’s going on when they pull in their data from wherever it lives,” said Raj Dutt, CEO of Grafana Labs, the company behind Grafana.

Netdata Agent v1.24: Prometheus/OpenMetrics collector and multi-host database mode

This release broadens our commitment to open standards, interoperability, and extensibility with a new generic Prometheus collector that works seamlessly with any application that makes its metrics available in the Prometheus/OpenMetrics exposition format, including support for Windows 10 via windows_exporter. Netdata will autodetect over 600 Prometheus endpoints and instantly generate charts with all the exposed metrics, meaningfully visualized.

How We Use Quarkus With Kafka in Our Multi-Tenant SaaS Architecture

At LogicMonitor, we deal primarily with large quantities of time series data. Our backend infrastructure processes billions of metrics, events, and configurations daily. In previous blogs, we discussed our transition from monolith to microservice. We also explained why we chose Quarkus as our microservices framework for our Java-based microservices. In this blog we will cover.

Performing Zabbix Alert Correlation and Incident Acceleration with CloudFabrix AIOps

CloudFabrix AIOps 360 solution can ingest alerts, events, metrics and from various monitoring tools to perform event correlation, alert noise reduction and enable incident resolution acceleration. Learn more about CloudFabrix AIOps 360 In this blog I will cover Zabbix integration aspects with our AIOps 360 solution. Zabbix is one of the popular open source monitoring platforms used by many enterprises and MSPs, including some of our customers.

Workspace Control Now With Ivanti Neurons for Edge Intelligence

Following the formation of the Independent Business Unit earlier this year, we’ve been refocusing our attention on Ivanti Workspace Control. With the previous release being mainly focussed on maintenance, security, and performance improvements, this Workspace Control 2020 release will be our first major release since then. Workspace Control 2020 introduces several significant new features while also incorporating many of your User Voice requests (please continue to share with us).