Operations | Monitoring | ITSM | DevOps | Cloud

Latest Posts

JavaScript Error Tracking with AppSignal v1.3.0 is Here

We’re happy to announce that the latest npm package for error tracking of your front-end with AppSignal has just been released. For those of you who aren’t really familiar with our error tracking service, we suggest you to take a deeper look into our docs. This was one of the bigger releases, and it includes many improvements and bug fixes. Here’s what we’ve done.

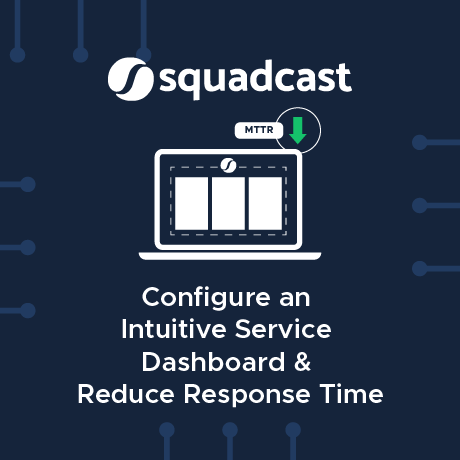
Configure an Intuitive Service Dashboard & Reduce Response Time

Leverage Multiple Alert Sources in Squadcast to reflect your actual system infrastructure on your Service Dashboard Having your Incident Management Tool reflect your system architecture is a big milestone in reducing cognitive load on your on-call team. In order to help our users move one step closer to this milestone, we recently released the functionality to add multiple alert sources to a service. You can now model your service dashboard to mimic your actual system architecture.

CIO Insights: The New Normal for IT - A Look Forward at Business & Operational Continuity

COVID-19 has impacted the lives of almost everyone on the planet. Health and safety are obviously the top concerns. But as everyone knows, it has also severely disrupted businesses worldwide and has, specifically, created chaos for CIOs as they struggle to ensure operational continuity even as things change in an unprecedented fashion overnight.

I worked exclusively from my phone for one week. Here's what happened

[This article was written in the wonderful age before coronavirus.] A week ago I spilled a full glass of water all over my computer. Horrified, I mopped up my laptop, turned it upside down, and let it dry in the sun. By some miracle, it still worked. But when morning came the next day, it was totally fried. As I waited for my IT manager to configure my new laptop, I turned to my phone to scroll emails and my work apps.

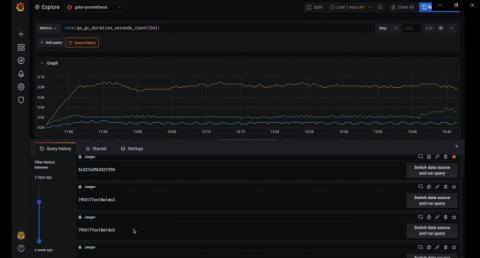
Grafana 7.0 sneak peek: Query history in Explore

Grafana v7.0 is coming next month! Here’s a sneak peek of one of its features: the query history in Explore. Query history lets you view the history of your querying. All queries that have been starred in the Query history tab are displayed in the Starred tab. This allows you to access your favorite queries faster and to reuse these queries without typing them from scratch.

Monitoring AWS Analytics

Amazon Web Services (AWS) products are countless, and at LogicMonitor, we are working tirelessly to bring monitoring support to as many of them as possible. With so many products and tools already on your plate, we want to make sure that monitoring is not a hassle, but rather a trusted companion. Here, we will focus on the analytics section of AWS and provide some tips on how to utilize the data collected from AWS Athena and Glue.

Mastering Azure Monitor, with Richard Benwell

With more and more businesses moving into the cloud, many of us are increasingly faced with the need to monitor our Azure applications in Azure Monitor – but where to start? If you’re feeling lost or overwhelmed by the platform’s sheer range of functionality, you’re not alone, and we’ve got some useful resources for you.

Announcing the Open Observability Conference

Today, I’m excited to announce the Open Observability Conference – a virtual event on May 27th at 11:00am EDT providing a platform for learning, sharing and discussion of open source observability technologies for DevOps teams around the globe. Register for the Open Observability Conference here.

StackStorm v3.2.0 released

May 1, 2020 By Eugen Cusmaunsa (@armab) and @punkrokk It happened! After a long wait, we’re more than excited to announce the StackStorm v3.2.0 release. The StackStorm project has had some turbulent times since the previous release almost one year ago. The new v3.2.0 version is the first release since the project joined the Linux Foundation, formed new Governance, and gathered a new team of Maintainers. Considering the amount of changes happened, it looks like a big restart for the project.

Page speed check: a comprehensive test of your site

Instant check You can run it any time from HostTracker main page for free - and it really helps to see how your website performs from different countries and find its weak spots, if there are any. Let us check what we see there, if we test google.com: Top line shows us basics about the loaded page: how many http requests have been made to complete it, if all of them were successful, its size and load time.