Operations | Monitoring | ITSM | DevOps | Cloud

Latest Posts

Everything you need to monitor a website

Website downtime can cause serious damage not only for your reputation and brand image, but also in productivity, all of which leads to business losses. A Gartner survey revealed that website downtime can cost companies up to $5,600 per minute. Recently, the world's biggest online retailer, Amazon, experienced a technical blotch leading to their website being inaccessible for 13 minutes, costing the company around $2 million in revenue losses.

Rails is Fast: Optimize Your View Performance

In this post, we’ll look into tried and true methods of improving Rails view performance. Specifically, I will focus on database efficiency, view manipulation, and caching. I think the phrase “premature optimization is the root of all evil” has been taken a little out of context. I’ve often heard developers use this during code reviews when simple optimization techniques are pointed out.

Loki 1.3.0 Released!

Welcome to 2020! (We’re a little slow with that on the Loki team.) To kick off the year we are releasing Loki 1.3! Anyone running Loki in microservices mode will be excited by this release as it introduces the Loki Query Frontend. (If you aren’t using microservices, be patient – good things will be coming your way soon.) The query frontend sits in front of the queriers and allows sharding queries based on time.

10 Alerts and Visualizations for S3 Server Access Logs to take control of AWS infrastructure

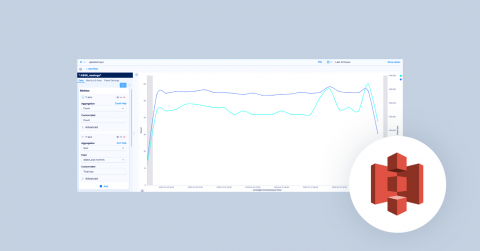
AWS S3 Server Access logs provide detailed records for requests made to S3 buckets. They’re useful for many applications. For example, access log information can be useful in security and access audits. It can also help generate customer insights and better understand your Amazon S3 bill. Coralogix makes it easy to integrate with your S3 server access logs via a Lambda function.

SLOs with Stackdriver Service Monitoring

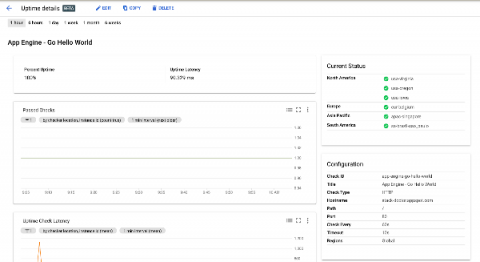
Service Level Objectives or SLOs are one of the fundamental principles of site reliability engineering. We use them to precisely quantify the reliability target we want to achieve in our service. We also use their inverse, error budgets, to make informed decisions about how much risk we can take on at any given time. This lets us determine, for example, whether we can go ahead with a push to production or infrastructure upgrade.

How To Auto Generate SSL Certificates On The Fly

Customers can generate hosted status pages that display the status such as availability, response time and incidents of their services (websites, API, infrastructure) to their own clients or for internal use. All status pages are hosted and maintained by our care. Users point a custom domain to our DNS, and after seconds their page is ready. Hassle free.

Unified Monitoring and the Paradox of IT Culture Change

I have a coffee mug on my desk that I got from a sales manager many years ago. It’s now filled with pens (I don’t drink coffee), but I take a look at it once in a while. I was starting to think about IT transformation again and noticed a picture of my daughter and an expired AAA card (I might have been thinking AARP) as I looked at that old mug… it reminded me I’m not getting any younger. But it also reminded me of a paradox of culture change.

Using Honeycomb to remember to delete a feature flag

Feature flags are great and serve us in so many ways. However, we do not love long-lived feature flags. They lead to more complicated code, and when we inevitably default them to be true for all our users, they lead to unused sections of code. In other words, tech debt. How do we stay on top of this? Find out how Honeycomb’s trigger alerts proactively tell you to go ahead and clean up that feature flag tech debt!

Elastic SIEM for home and small business: Beats on Mac

Hey, there. This is part six of the Elastic SIEM for home and small business blog series. If you haven’t read the first, second, and third blogs, you may want to before going any further. In the Getting started blog, we created our Elasticsearch Service deployment and started collecting data from one of our computers using Winlogbeat. In the Securing cluster access blog, we secured access to our cluster by restricting privileges for users and Beats.

Embracing Chaos With BigPanda's Root Cause Analysis Features

The ever-growing complexity, scale and pace of IT environments puts a huge burden on IT Ops, NOC, and DevOps teams, who are tasked with keeping these environments up and running. One of the biggest challenges is Root Cause Analysis (RCA). When something breaks, they need to determine what broke it, and they need to do it fast.