Operations | Monitoring | ITSM | DevOps | Cloud
Latest Posts
Elastic Advent Calendar, 2019: the full recap!
Wow, it's finally here! After 25 fantastic articles we've reached the end of the 2019 Elastic Advent series. We've covered Elasticsearch and Python, Auditbeat, ECS, data transform, jvm options, anomaly detector models, Maps, SSL configuration, Smart query cancellation, data transforms, SLM, the new enrich processor, App Search, and so much more. In the topics we've spoken in German, Greek, English, French, Finish, Spanish and Swedish.
A 5-Step Recipe for Spot-On Alerts - That May Just Save Your Marriage
While checking in recently with one of Anodot’s newest clients, I got the sort of feedback that every product owner loves hearing. I asked, “During this past month, have you been able to check alerts triggered for your region? Do you use them? Do you have any feedback?” They replied, “The alerts are spot on. Thanks all.” The company then went on to adopt Anodot across more teams. So why are we so obsessed with alerts being spot-on?
How to Reduce Docker Image Size
Recently, I have been tasked to migrate the existing set of Docker images from Ubuntu to RHEL UBI. The product has more than 25 images, so keeping the new image size as small as possible is one of the goals while migrating the images. Everyone is well aware of the advantages of keeping the Docker image size small for the following reasons...
Server monitoring best practices for superior server performance
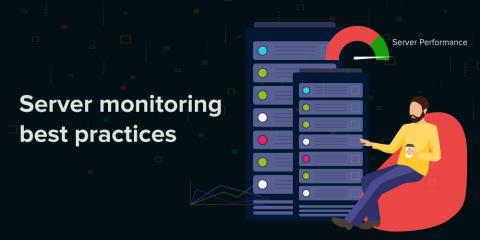
Server admins are tasked with keeping an eye on server availability 24x7 and ensuring all mission-critical applications are up and running; this includes monitoring CPU, memory, and disk performance. It's critical for server admins to understand how to effectively monitor server performance, as well as how to proactively troubleshoot issues.
G2 recognizes ManageEngine as a High Performer in the Unified Endpoint Management (UEM) category for Winter 2020
ManageEngine’s unified endpoint management solution,, Desktop Central, has been recognized as a High Performer and Momentum Leader in G2’s winter report for 2020. This is the second time in the past six months that Desktop Central has been named a High Performer in G2’s Unified Endpoint Management category.
Prometheus and Grafana: A Match Made in Heaven?
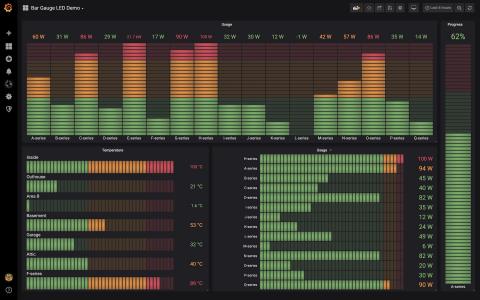
Prometheus and Grafana are two monitoring tools that, when combined, provide all of the information DevOps and Dev teams need to build and maintain applications. Prometheus collects many types of metrics from almost every variety of service written in any development language, and Grafana effectively queries, visualizes, and processes these metrics.
What is Server Monitoring? Beginners Guide to Server Performance Monitoring
Server Performance Monitoring is referred to as consistent monitoring of all network infrastructure, related to servers to analyse their resource utilisation trends & later on optimize it for a smooth end-user experience. Server Monitoring makes admins sure about server’s current state and whether or not it is capable of hosting business-critical apps, thereby offering you a complete view into the state of your system – whether it is working or not.
ICYMI: The 10 Most-Read Blog Posts of 2019
As 2019 comes to a close, we’re looking back at the 10 most-read blog posts of the year. (We’re not including the also-popular release posts in this list.) Here’s another chance to check them out in case you missed them the first time around.
What We Learned About Uptime from 2019 Website Outages
One thing we’ve always known: there’s no such thing as 100% uptime for any website. Too many variables are at play to keep a site from staying up all the time. From traffic surges to hardware failures and everything in between, keeping sites up and running is a full-time job for SREs and IT pros. Here at Uptime.com, we track major downtime all year long to provide websites of all sizes with lessons in how to catch downtime and resolve incidents quickly.


