Operations | Monitoring | ITSM | DevOps | Cloud

Latest Posts

StrandHogg vulnerability threatens 500 of the most popular Android apps

Earlier this month, security researchers at Promon, a Norwegian firm that specializes in in-app security, uncovered a unique vulnerability in Android devices that allows malicious apps to masquerade as legitimate apps and prompt for intrusive permissions that allow them to: Listen to the user through the microphone, Take photos using the camera, and a lot more.

ServiceDesk Plus named Contender in the Enterprise Service Management space by independent research firm

Forrester has recognized ManageEngine as a contender in the Enterprise Service Management (ESM) space in its latest Forrester Wave: Enterprise Service Management, Q4 2019 report. The report covered twenty-three criteria and recognized fifteen providers in the ESM space.

How to avoid on-call burnout

It sucks to be on-call when processes are not well defined and streamlined. Especially around the holidays. You really don't want to hear your phone repeatedly going off right when you're sitting for Christmas dinner with your loved ones or getting to unwrapping the good presents (the ones with the sparkly wrapping paper :P). Your on-call team’s stress levels reflects the health of your system, the cleanliness of your code and the culture of your organization.

Announcing GroundWork Monitor 8

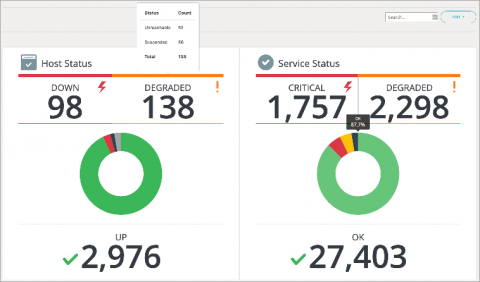
GroundWork Monitor 8 is a new version of a mature product, GroundWork Monitor Enterprise. As such, a lot of what is inside of this version will be familiar to users of prior versions. For example, we are still using the same bundled GPL Nagios™ and GroundWork Distributed Monitoring Agent (GDMA), and we are still including NeDi and Cloud Hub as data feeds. Then again, much is very new. We have completely re-worked the status screens and made them much more responsive.

2020 Visionaries: Predictions For The Digital Workplace

The digital workplace of the future is right around the corner and many enterprise tech leaders are probably wondering: How can I be prepared for the changes that lie ahead? Luckily, we’ve gathered together some of the brightest minds in the game to deliver their predictions. These experts range from technology leaders and analysts that have devoted their careers to pushing the limits of the digital workplace.

How to Use Graylog Lookup Tables

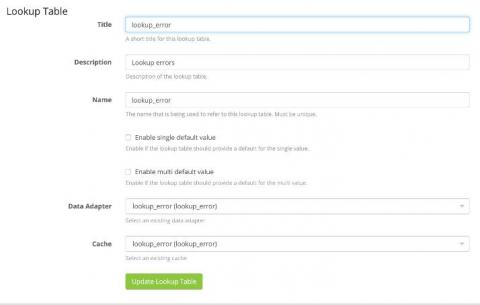
Logs are a wealth of information containing meta-data from IP addresses, User Names, and error codes. While this is all extremely helpful, the task of understanding all this can seem overwhelming at times to an untrained eye. Other times, corporations might have additional resources they would like to enrich their logs with, i.e., adding a department name to a log message that depends on the username in the log.

SAP HANA monitoring with Datadog

SAP HANA is a data analytics platform that uses an in-memory, column-oriented data store to efficiently execute transactional (OLTP) and analytical (OLAP) queries. It can perform these queries against its own tables, or against data that resides in remote, non-SAP databases like Hadoop or SQL Server. SAP HANA also serves as the database behind SAP’s S/4HANA ERP platform. Datadog’s new integration helps you better understand the health and performance of your SAP HANA systems.

Why actionable data is worth its weight in gold and more from our Tech Leaders' Tour

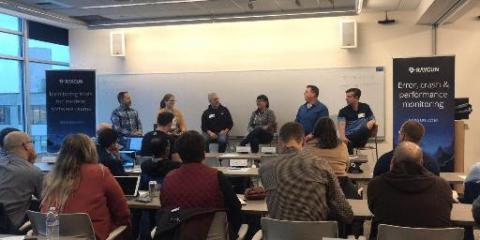
Monitoring today is more complex and nebulous than ever before. Teams have to deal with barriers like tooling, data overwhelm, and process problems making it difficult to get a clear line of communication from code to customer. In our Portland Tech Leaders’ event, our seasoned host Scott Hanselman, Partner Program Manager at Microsoft, takes us on a deep dive into how our experienced panel use tools, processes, and agile workflows to overcome these hurdles to create world-class software.

Measuring the unmeasurable - How AWS, Alexa, Tableau Software and Raygun monitor what matters

“3.7%. That’s how penetrated the cloud market is today. We’re talking a trillion-dollar market only penetrated by 3.7%. The world is up for grabs.” “Customers are not going to want technology to be slower. They’re not going to want it less performant or less secure.

Debugging a Segfault in Rust

In case you missed our pair programming session about how to run, crash, and debug a Native application using Sentry, worry not! Our artificial intelligence Richard — much more intelligent than it thinks — has used its special powers to upload a recording of our session. This time, we chose a very special victim: Symbolicator. That’s the service responsible at Sentry for processing native crash reports.