Operations | Monitoring | ITSM | DevOps | Cloud

Latest Posts

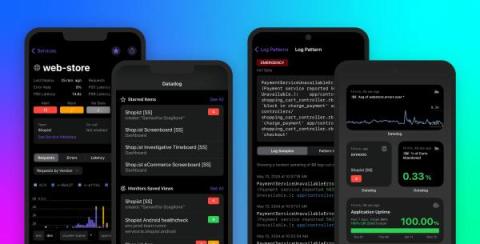
Getting started with the Datadog mobile app

The Datadog mobile app can help you make the most of the deep visibility Datadog gives you into your applications and infrastructure. In addition to helping you monitor key metrics, facilitating alerting, and smoothing the way for coordination among teams, the mobile app gives you the resources and context to investigate issues and respond to incidents from anywhere.

NIS2 Implementation: Challenges And Tips From EU Experts

Let’s be honest. Keeping up with cybersecurity regulations and directives, especially if your organization operates within the European Union (EU), can be really challenging. And NIS2 implementation is no exception. If you are working in this field, you might already know the reasons that originated this legislation, its objectives, and the risks that organizations face as technology evolves. However, there is a gap between understanding NIS2 and its current implementation.

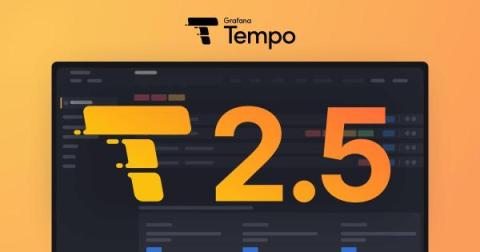
Grafana Tempo 2.5 release: vParquet4, streaming endpoints, and more metrics

Grafana Tempo 2.5 is here with performance improvements, vParquet4 laying the groundwork for new TraceQL features, and additional metrics capabilities! Watch the video above for a highlight of TraceQL metrics, or continue reading to get a quick overview of the latest updates in Tempo. If you’re looking for something more in-depth, don’t hesitate to jump into the Grafana Tempo 2.5 release notes or the changelog.

Building the Cribl Lake Team: A Customer-Centric Approach

In today’s fast-paced tech landscape, how does a company ensure that its products truly meet the needs of its customers? At Cribl, the answer lies in our unwavering commitment to a customer-centric mindset. This philosophy has driven our success, enabling us to develop groundbreaking solutions like Cribl Lake. The story of Cribl Lake is not just about the product itself but also about the people behind it and our unique approach to building the team that brought this solution to life.

Logz.io Upgrades App 360, Kubernetes 360 with AI Assistant, New Tracing Quickview

At Logz.io, we believe the future of observability will center on the rapid advancement of automation, innovations around artificial intelligence, and streamlining processes that currently remain far too complex. This is no different than many other areas of technology, but the opportunities in observability are vast, and we see all of these areas connecting and driving improvements to the Logz.io Open 360 platform.

Top ELK Stack Alternatives in 2024

In a typical scenario, the software you create is usually hosted on a single server, which generates a lot of log messages for your application. However, things have changed a little bit now. In today's world, there are no longer single servers. Instead, there are likely to be tens or even hundreds of virtual machines running behind a load balancer, and each one generates thousands of log messages every day. The question is, This is where ELK Stack plays its role.

Four Golden Signals: Key Indicators for System Reliability

System reliability is crucial for providing seamless user experiences and enabling effective business operations. The "4 Golden Signals" —latency, traffic, errors, and saturation—offer a comprehensive view of system performance and potential issues. In this blog, we deep dive into system reliability and explore these four key metrics for monitoring system health and ensuring optimal performance.

The impact of emerging market trends on the edge data centre industry

The edge data centre market (broadly defined as smaller, more distributed data centres, localising data storage and compute closer to end users) is experiencing 92% year on year growth. This growth is being driven by a combination of factors including: Three of the biggest trends impacting the edge data centre market today are.

What Is Data-Driven Website Design?

Data-driven web design is a strong approach that uses quantitative and qualitative data to guide design decisions and improve the user experience. By looking at website visitor analytics, user behavior data, feedback, and other insights, designers can make informed changes to increase engagement, conversion rates, and overall user satisfaction. This article will look at the types of data used in data-driven design, the advantages of this approach, and how to use it in your website development process.