Operations | Monitoring | ITSM | DevOps | Cloud

Latest News

Monitoring Amazon EKS logs and metrics with the Elastic Stack

To achieve unified observability, we need to gather all of the logs, metrics, and application traces from an environment. Storing them in a single datastore drastically increases our visibility, allowing us to monitor other distributed environments as well. In this blog, we will walk through one way to set up observability of your Kubernetes environment using the Elastic Stack — giving your team insight into the metrics and performance of your deployment.

MITRE ATT&CK® round 2 APT emulation validates Elastic's ability to eliminate blind spots

Six months ago we celebrated the joining of forces between Endgame and Elastic under the banner of Elastic Security and announced the elimination of per endpoint pricing. Simultaneously, while the newest members of Elastic Security were getting acquainted with the Elastic SIEM team, a few of our analysts were locked away in an office at MITRE HQ for round 2 of MITRE’s APT emulation.

Should I Stay or Should I Go? A cloudy decision

If you’ve been operating in the cloud for some time now, chances are your business has changed since you first made that move. Has your cloud usage grown considerably—and your OpEx costs? Is that just the cost of doing business in the cloud? It doesn’t have to be. Here’s how you can rationalize your infrastructure and determine if there are cloud expenses you can reclaim and even if it makes sense to move some of your cloud deployments into co-location.

Best Practices for Data Tagging, Data Classification & Data Enrichment

Data classification can be broadly defined as the process of organizing and tagging data by categories so that collected data may be used and protected in the most efficient way possible. Sumo Logic is an analytics platform that can ingest almost any type of machine data. This data can be structured or unstructured, come in the form of event logs and messages or as time-series metrics. Once the data has been ingested into the platform, it can be leveraged for a wide variety of use cases.

How's Your Wi-Fi Signal? IT's Remote Work Blind Spot

Close your eyes for a moment and think of the least tech-savvy person in your family. Ok, open them. This person, even with their limited tech skills, probably understands that the farther you stray from your Wi-Fi router, the worse your connection will be. Incredibly, Chris and I can count between us over a dozen customers whose IT support teams failed to consider this one factor. How could something so simple fly under the radar of enterprise IT?

What Causes Website Downtime?

We’ve all experienced websites which are unreliable, and appear to be offline when we need to access them. Perhaps you have had a similar experience with your own website, and know how damaging downtime can be to your bottom line and to your brand image. Whether a website is ‘down’ for an extended period of time, or for a matter of minutes, it can be extremely frustrating for anyone who is trying to access the site in that period.

Top 11 Digital Tools to Boost Your Productivity

As far as productivity is concerned, you cannot afford to stay complacent. That is because, without productivity, it is not possible to thrive in this age of stiff competition. Today, you have numerous things to do, perform multitasking to stay ahead of the competition and if you haven’t done so yet, your business will take a backseat.

So How Are Developers Feeling During the COVID Health Crisis? We Decided to Ask...

As a developer-focused company, InfluxData is always interested in how the community is doing. During the first two weeks of April, we conducted an online survey to find out how developers are handling life and work during the COVID-19 pandemic. A total of 324 self-identified software developers/engineers from across the world responded (46% from North America, 44% from Europe, 9% from South America, and 1% from Africa) to share their feelings during this unprecedented global event.

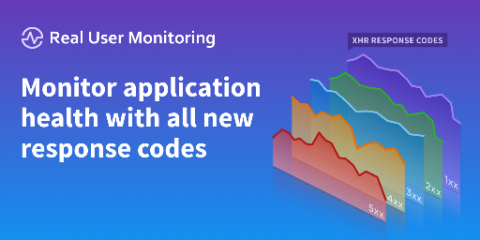
Monitor application health with the new response codes tab in RUM

In this release, we’re bringing an all-new section to Real User Monitoring to provide another way for you to monitor application health; the Response Codes tab. Real User Monitoring now tracks the response codes from XHR/AJAX calls made in your web application using the JavaScript provider. You can now: Stacked view of your application’s response codes This feature brings vital insight into the health of your applications so you can deliver the software experiences your customers deserve.

Ruby performance tips - how to optimize code from the ground up

Over the last few years, more developers have taken Ruby as their staple programming language. Who can blame them? It certainly has a lot of appealing features. For one, the syntax is easy to read and debug. A default MVC architecture within most Ruby frameworks is another alluring factor that may have had you using it as well.