Operations | Monitoring | ITSM | DevOps | Cloud

Latest News

Introduction to Error Handling in Angular 7 Using Rollbar

In this tutorial, you will be introduced to errors tracking in Angular 7 using the errorHandler class and Rollbar. This is the last part of the Angular 7 error handling series, you can refer to the first part here, and the second part here. In this series, you have been introduced earlier to handling client side errors and then HTTP errors gracefully in Angular 7 with tools like errorHandlers, Interceptors and even RxJS operators.

Understanding Systemic Issues: The PagerDuty Health Check Process

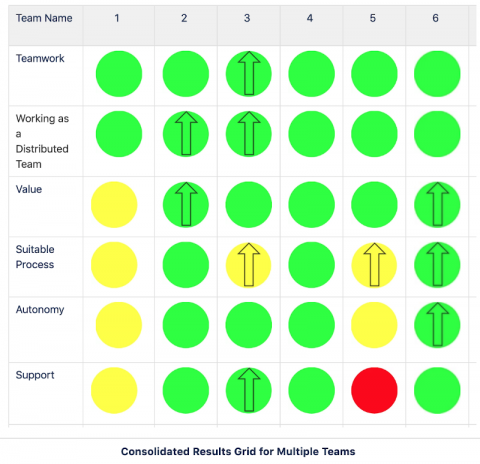
Continuous improvement is one of the fundamental tenets of Agile methodology that PagerDuty’s product development teams emphasize. This already works fairly well at the individual team level via retrospective meetings and postmortems but sometimes we don’t notice larger or systemic issues that are outside the control of a single team. This blog will share the process that we use at PagerDuty to uncover those issues, the outcomes we have seen, and how we have evolved that process.

Software Engineers: Confidence Matters Just as Much as Ability

Software engineering is a skilled task; those who obtain the experience and credentials necessary to become engineers know this, as do their employers. Engineers have an overarching goal of using these skills to construct experiences that enable end-users to complete a task successfully and they hope to provide enjoyment and comfort along the way. Anyone who has written software used by a decent number of people knows how daunting this task is.

Integrate Akamai mPulse real user monitoring with Datadog

Akamai mPulse is a real user monitoring (RUM) service that enables organizations to get deep visibility into end user experience across their websites or applications. With mPulse, businesses can collect high-granularity metrics directly from their users’ browsers, and then analyze that data to pinpoint slow resources (e.g., third-party scripts), track user engagement, and make decisions to improve the performance of their products.

New in Grafana v6.3: Introducing Loki's Log Row Context Viewer

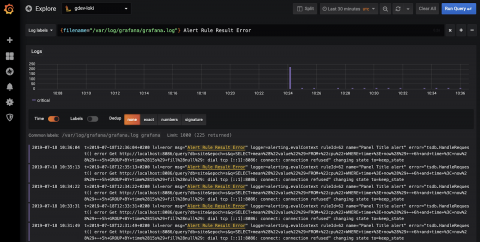
With the release of Grafana v6.3, we are introducing a significant improvement to Loki’s log exploration workflow in Grafana Explore. Launched at KubeCon North America last December, Loki is a Prometheus-inspired service that optimizes storage, search, and aggregation while making logs easy to explore natively in Grafana. Loki is designed to work easily both as microservices and as monoliths, and correlates logs and metrics to save users money.

Watching the Chaos: Monitoring and Chaos Engineering

The online world is full of contrasts. On the one hand, you have site reliability engineers whose job is to keep the business running by ensuring an app’s smooth operations. On the other hand, you have the DevOps staff, whose goal is to minimize cycle time—the time from business idea to feature in production. These two teams can have conflicting objectives.

What 20 acquisitions taught us about post-merger integration

Maybe your company just merged with another organization. Or perhaps you were a member of a group that was just bought out. Chances are you’ve been there: more than 75 percent of industries have become more concentrated since the late 1990s and the mergers and acquisitions boom is only expected to grow.

SQS and Lambda: a Quick Tutorial and How to Handle Failure Modes

Since Lambda added SQS as an event source, there has been a misconception that SQS is now a “push-based” service. This seems true from the perspective of your function because you no longer have to poll SQS yourself. However, SQS itself hasn’t changed – it is still very much a “poll-based” service. The difference is that the Lambda service is managing the pollers (and paying for them!) on your behalf.