Operations | Monitoring | ITSM | DevOps | Cloud

Latest News

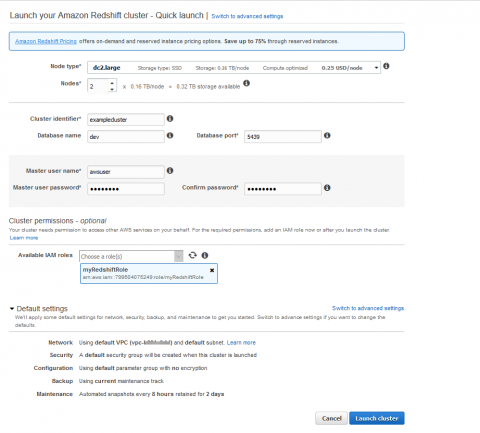
What is Amazon Redshift?

In this blog series, we will cover how Amazon Redshift and Sumo Logic deliver best-in-class data storage, processing, analytics, and monitoring. In this first post, we will discuss how Amazon Redshift works and why it is the fastest growing cloud data warehouse in the market, used by over 15,000 customers around the world. When an organization gains traction, the size of data that needs to be stored, monitored, and analyzed expands exponentially.

11 Simple Java Performance Tuning Tips

It’s one thing to write code that works. But what about clean, readable, concise code? That’s another thing entirely. To create an app that solves one problem? Not that hard. What about one that not only solves the problem, but it’s also easy and pleasurable to use? Now we’re talking. You could apply the same reasoning for many software properties, which would make for a long article. Instead, let’s focus on only one of those properties: performance.

How to Choose a Linux Distro for Your Server

By Des Nnochiri Whether it’s for network and system administration, database management, web services, or other business functions, chances are you’ll need robust servers as part of your IT infrastructure armory. Traditionally, a server running a Linux operating system has been the preferred option for enterprise use. But which Linux distribution (or distro) is the right one for your particular use case?

Monitor Harbor container registry with Datadog

Harbor, developed by VMware and hosted by the CNCF, is an open source registry for container images and Helm charts. Hosting Harbor within your infrastructure gives you a number of advantages over using the default Docker registry, such as role-based access control, security scanning, and replication of resources between registry instances. Since a failed Harbor deployment can spell trouble for your containerized workloads, monitoring your self-hosted container registry is critical.

Loki's Path to GA: Version 0.2.0

Friday, August 2, marked the second beta release for Loki, a long overdue version 0.2.0. Why did it take so long? In large part this was my fault. Having done some work to create a release process for version 0.1.0, I found myself focusing on other things, so improving that process ended up on the backburner. This entire time, in the back of my mind, I was delaying a new release until I could improve that process.

Zooming in on UEBA: Answering the "what" and the "how"

User and entity behavior analytics (UEBA) is a relatively new category of cybersecurity tools that utilize machine learning (ML) algorithms to detect abnormalities in the behavior of the users and entities that belong to an enterprise network. UEBA monitors and continuously learns from the behavior of various user accounts and devices in the network, and establishes a baseline behavioral profile for each using statistical and probability models.

Optimizing Business Response When Technical Incidents Happen

Most technical incident response plans typically account for stakeholder communications—for both internal teams and external customers. But at PagerDuty, what we’ve learned from our customers is that there’s still a painful and expensive gap in alignment between IT and business teams. To close that gap, we need to focus on what incident response means for business teams.