Operations | Monitoring | ITSM | DevOps | Cloud

Latest News

Using Elasticsearch Rollover to manage indices

In this article you will learn how to configure and use the Elasticsearch rollover feature in Jaeger. Note that this feature has been introduced in Jaeger 1.10.0. Jaeger uses index-per-day pattern to store its data to Elasticsearch. It creates a new index for each day based on span’s timestamp. These indices have to be periodically removed by jaeger-es-index-cleaner cron job. Typically users keep data from one week up to one month which results in 7 or 30 indices only for spans.

OpsRamp Launches New Partner Program to Help Technology and Solution Partners Deliver Greater Customer Value

Having worked with managed service providers, technology integrators, value-added resellers, and cloud service providers across the world, OpsRamp understands what it takes to create great partnerships. Over the last five years, we have learned a lot about fostering smart and committed relationships with our partner ecosystem. Relationships are key in a world of rapid change and constant innovation. Healthy partner relationships require constant nurturing, collaboration, and enablement.

To SIEM or not to SIEM?

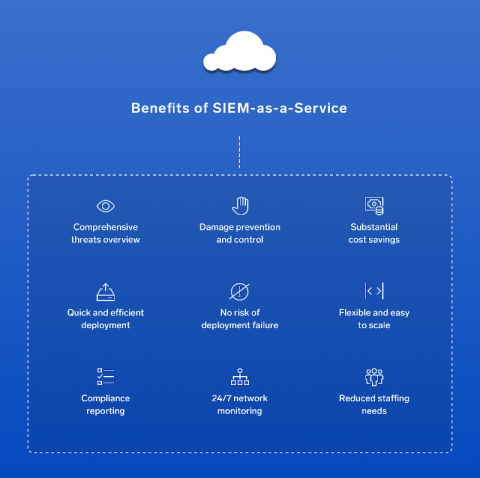
Not investing in Security Incident and Event Management solutions means you’re missing out on significant business benefits. SIEM detects and responds to security incidents in real time, which reduces the risk of noncompliance. It also helps realize greater value across all underlying security technology and systems. Reporting with SIEM is more comprehensive and less time-intensive, helping to reduce capital and operational costs through consolidation.

How to use Single Sign-On in LogDNA (SSO)

Single sign-on (SSO) is an authentication model designed to let users access different applications, services, and resources using a single set of credentials. Instead of having multiple user accounts for different applications, users are assigned a single centralized account that is used to authenticate with each application. This makes it more convenient for users to authenticate, while also making it easier for IT administrators to manage multiple accounts.

Local AWS Lambda Development For All

Starting today, any developer can locally debug and develop any Lambda function, in any language or framework, against live cloud resources with any IDE, for free. You don’t even need a Stackery account. This capability can be obtained by installing the Stackery CLI either automatically via the Stackery VS Code Serverless Tools Plug-In or manually alongside any IDE.

Building better software with automated monitoring and alerting

This is a guest article by Dan Holloran from VictorOps – an on-call alerting and incident response tool recently acquired by Splunk. They are experts in incident management. In software development and IT operations, we tend to focus a lot of our time on the delivery and deployment pipeline. But, what happens after you deploy new services? How are you responding to incidents in production and identifying reliability concerns?

Sponsored Post

The 7 best Real User Monitoring tools for 2019

As applications become more complex, a single JavaScript error can really make a difference to your bottom line. The average Fortune 1000 company, after all, spends upwards of $2.5 billion each year on unplanned application downtime. When an app doesn't work like it's supposed to, it doesn't exactly inspire users to continue fidgeting with it.

Test before launch: new Development, Staging, and Production modes

Previously your Uptrends monitors were either enabled or disabled; not anymore! For Professional, Business, and Enterprise accounts, you now have three options in your monitoring settings: Development, Staging, and Production mode. You can now choose between three monitor modes:

Understand, explore, and collaborate with Dashboard Details

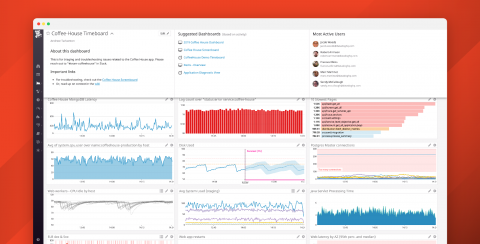
Dashboards provide critical visibility into the performance and health of your environment. But if your organization uses hundreds or thousands of dashboards, or if you’ve recently transitioned to a new company or different team, it’s not always easy to understand the full significance of the data shown on every single dashboard.