Operations | Monitoring | ITSM | DevOps | Cloud

Latest News

How to Reduce Bounce Rate

In the field of website optimisation a term which often crops up more than any other is that of ‘bounce rate’. When discussions about your website take place, you may have heard in passing that ‘your bounce rate is too high’, or that ‘we need to reduce the bounce rate to increase rankings’. But what do you do if your bounce rate is too high, and how would you go about reducing a high bounce rate?

Serverless Summer School Cliff's Notes - AWS Serverless Products, Explained

School’s out for… Autumn? That’s right, while you were avoiding the back-to-school rush at Office Depot, cutting the crusts off PB&Js, and taking the layers out of mothballs (confession: I have never seen let alone used a single mothball), Serverless Summer School began winding down and is now over for the season. Until next year, school-themed Stackery livestreams!

Monitor a Laravel app with Scout

Last month we talked about the PHP monitoring landscape in 2019 and announced that Scout APM would soon be available for monitoring your Laravel applications too (as well as your Ruby, Python and Elixir apps of course!). Now that our PHP monitoring agent is ready for beta testing, we thought it would be a good idea to show you folks how easy it is to get started with it and to highlight the main features to the Laravel community.

Startup CTO: How to Hire Software Engineers

At some point, your startup will scale to the point that you need additional help building your product, and as the CTO, it’s up to you to find, hire, and onboard new software engineers. This process is intimidating because engineering hires are critical to the success or failure of your startup. In this series, we’ll talk about Blue Matador’s approach to the hiring process as well as the insights I’ve gained as CTO. This first post will cover when and who to hire.

The (Mostly) Complete History of Grafana UX

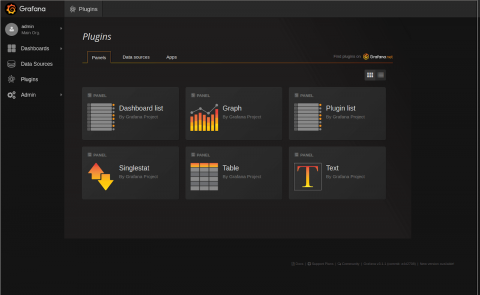
Before Grafana, there was Kibana 3. Kibana was revolutionary when it came out, because it allowed you to use Elasticsearch in a very new way, for log analytics and not just normal document search, and to build dashboards without writing JSON documents. It had this nice UI, which let you drag panels around. But editing panels was a little tricky; you could only edit them in this sort of fullscreen modal. Still, it was really good for its time.

The Power of Audit Logs

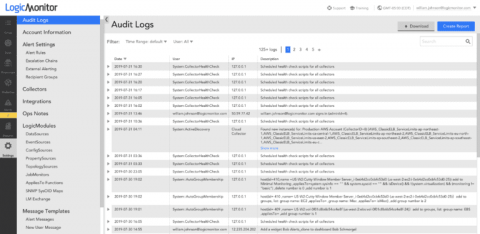
If you’re a LogicMonitor customer, the platform’s Audit Logs may seem like a rudimentary means to track user actions, but they can actually be a powerful tool for troubleshooting and getting historical data within your portal. For instance, let’s say you notice that the alerting for a particular device group has been unexpectedly disabled.

Introducing Scheduled Reporting

We’re happy to announce the release of Logz.io Reports — an easy way to set up scheduled reporting for both operational and security use cases. Kibana dashboards provide you with a window into your environment, visualizing the different signals being tracked in a beautiful mix of graphs, charts, and maps. Often used in times of crisis and as the starting point for an investigation, dashboards can also be useful as a static reporting tool for multiple use cases.

Automation Everywhere: The Key to Reimagining IT & the Role of the CIO

The world is undergoing profound change and technology sits at its beating heart. Digital transformation offers unprecedented opportunities for CIOs to support business demands for innovation-fueled growth. In so doing, IT leaders can also cement their position as indispensable members of the executive suite.