Operations | Monitoring | ITSM | DevOps | Cloud

Latest News

Demonware's journey to assisted remediation

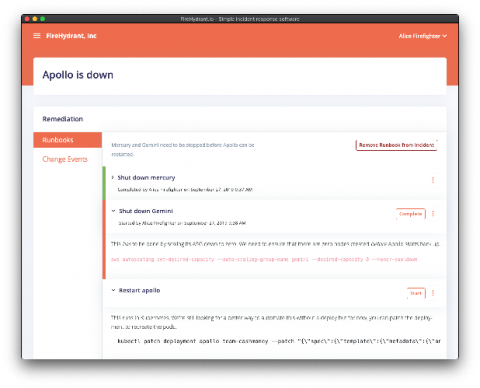
At Monitorama 2018, Engineering Manager Kale Stedman shared Demonware’s journey to assisted remediation, or as he likes to call it: “How my team nearly built an auto-remediation system before we realized we never actually wanted one in the first place.” In this post, I’ll recap Kale’s Monitorama talk, highlighting the key decisions that helped his team reduce daily alerts, fix underlying problems, and establish a more engaged Monitoring Team — including the steps the

The Complete Guide to Azure Monitoring

Monitoring an Azure environment can be a challenging task for even the most experienced and skilled team. Applications deployed on Azure are built on top of an architecture that is distributed and extremely dynamic. But all is not doom and gloom. Azure users have a variety of tools they can use to overcome the different challenges involved in monitoring their stack, helping them gain insight into the different components of their apps and troubleshoot issues when they occur.

Understanding Heroku Error Codes with Scout APM

If you are hosting your application with Heroku, and find yourself faced with an unexplained error in your live system. What would you do next? Perhaps you don’t have a dedicated DevOps team, so where would you start your investigation? With Scout APM of course! We are going to show you how you can use Scout to find out exactly where the problem lies within your application code.

Grafana Tutorial: Simple Synthetic Monitoring for Applications

Often there’s a focus on how a service is running from the perspective of the organization. But what does service health monitoring look like from the perspective of a user? There are many metrics that indicate the overall health of a container, vm, or application, but independently they do not indicate if the system is functioning correctly. Often these metrics (CPU, disk, memory) are too narrow, and they can be poor indicators. High CPU may be desirable or bursts of memory usage may be normal.

Kubernetes: Tackling Resource Consumption

This is the third of a series of three articles focusing on Kubernetes security: the outside attack, the inside attack, and dealing with resource consumption or noisy neighbors. A concern for many administrators setting up a multi-tenant Kubernetes cluster is how to prevent a co-tenant from becoming a “noisy neighbor,” one who monopolizes CPU, memory, storage and other resources.

Uptime.com Check Types | How to Build the Ultimate Uptime Monitoring System

How much infrastructure for a domain or application can fail before the customer starts to notice? What about before your productivity is affected? The answer to these questions will help you fully utilize uptime monitoring. Here are just a few examples of services that can be monitored for better piece of mind.

The Mythical 'Average' IT Shop

In health care, doctors know the average man or average woman is in fact, mythical. Everyone has their own unique problems, capabilities and life stories. DNA can be altered by the environment. Even identical twins will have different health histories and different propensities to contract and avoid certain illnesses. Each individual is different. The same can be said of IT — no two shops are ever exactly alike.

Sentry for Good

Errors are expensive; they steal resources allocated for other things and potentially negatively impact revenue and user sentiment. And, for teams comprised of volunteers working in their spare time, errors can take weeks to triage and resolve. So, despite what Google might tell you, Sentry for Good is not merely a solution to your pet’s pesky pheromone problems (although it is clearly also that, if PetSmart’s Google results are any indication).