Operations | Monitoring | ITSM | DevOps | Cloud

Latest News

Healing Bots Take Charge of Solving IT Problems to Enhance Employee Satisfaction

Imagine an Everywhere Work environment in which IT problems seem to magically resolve themselves before end users even realize there were issues. Printers miraculously start working again. Login issues vanish. Access to critical applications is seamless.

Metrics IDPs move: How to measure the impact of your Internal Developer Portal

Internal Developer Portals (IDPs) have increasingly found their way to the center of engineering operations. As the new engineering system of record, IDPs make it possible to align and enforce standards while unlocking safe developer self-service. Of course, oft-cited benefits like removing friction and improving consistency might feel intangible or even duplicative to other tools in your stack. So how should engineering leaders think about evaluating IDPs?

6 Steps to Create Actionable Postmortems

In DevOps and IT operations, conducting a thorough postmortem after an incident is crucial for continuous improvement. This article explores best practices for creating effective postmortems, ensuring that your incident analysis won't be forgotten as soon as the danger has passed but will be comprehensive and actionable.

Google VPS Pricing Explained: A 2024 Guide

Organizations are turning to Virtual Private Servers (VPS) for scalable and cost-effective hosting solutions. Google offers a robust VPS option tailored to various organizational needs. Understanding Google VPS pricing can help you make informed decisions and optimize your cloud costs. This guide will explain Google VPS pricing, explore its uses, and provide tips for optimizing these costs with CloudZero.

Communicate scheduled maintenance with StatusIQ

Failure to communicate scheduled maintenance often results in unexpected downtime, significantly impacting the user experience by causing frustration and disrupting workflow. This not only leads to user confusion but also burdens IT support teams with a surge of customer queries. Gain deeper insights into effective strategies and best practices for communicating schedule maintenance activities clearly to stakeholders through this blog.

Jaeger vs New Relic - Choosing Your Ideal Tool

If your application is as busy as a highway with multiple lanes, intersections, and exits, imagine trying to track the journey of a single car from start to finish. Sounds tricky, right? Well, that's what happens when you're dealing with modern, complex software systems. Enter distributed tracing, your trusty GPS for navigating the intricate web of microservices and dependencies within your applications.

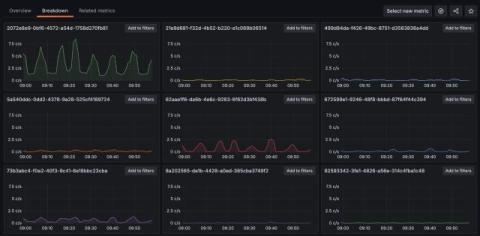
How to use OpenTelemetry resource attributes and Grafana Cloud Application Observability to accelerate root cause analysis

Let’s imagine a scenario: you use OpenTelemetry, and your observability backend runs on several hosts. You collect data on application latency, and notice a recent increase that you want to investigate. But how will you know which host caused the degradation? This is exactly where OpenTelmetry resources come in. In the context of OpenTelemetry, a resource represents the entity producing the telemetry data, such as a container, host, process, service, or operating system.