Operations | Monitoring | ITSM | DevOps | Cloud

Latest News

4 Reasons Why Your Business Needs Network Detection and Response Solutions

Endpoint protection has long been fundamental to cybersecurity. But in today’s evolving and expanding digital landscape, with endpoints spanning a wide variety of devices, is traditional endpoint security enough? The ongoing frequency of successful cyberattacks suggests not. Cloud proliferation, remote work and expanding system access add to the challenge. Can you truly trust users to keep their devices secure amidst this shifting landscape?

New Teams Client Challenges Draining Valuable IT Time? Vantage DX Can Help

Microsoft has pushed the end of availability for the classic Teams client from March 31, 2024 to July 1, 2024. This move will give administrators more time to address any issues they have encountered while transitioning to the new Teams app. Since its general availability in October 2023, enterprises have migrated users to the new Teams client and many have experienced both performance and functionality issues that have impacted user productivity and consumed considerable IT resources.

AIOps vs. Observability: Which Is Better and Why?

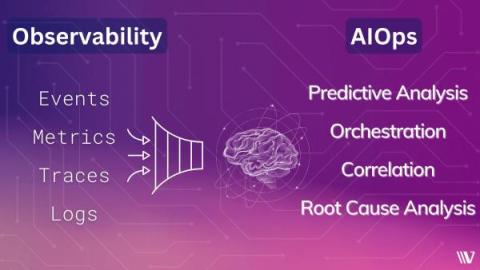
If you’ve been keeping up on what’s buzzing in the IT operations and software development space in the past few years, then you know that the concepts of AIOps and observability have been getting a lot of attention. And while they are related, they each address a different aspect of managing and monitoring IT systems.

The engineering on-call experience: misconceptions, lessons learned, and how to prepare

The on-call experience is sometimes a dreaded one for software engineers. Those late-night alerts and frantic Slack messages, after all, don’t exactly sound pleasant. But what’s an on-call shift really like? Is that perception of constant fire-fighting and 3 AM wake-up calls actually realistic? Michael Mandrus and Owen Smallwood, both senior software engineers here at Grafana Labs, wanted to set the record straight.

InfluxData Collaborating with AWS to Bring InfluxDB and Time Series Analytics to Developers Around the World

SAN FRANCISCO – March 14, 2024 – InfluxData, creator of the leading time series platform InfluxDB, today announced a collaboration with Amazon Web Services (AWS) to deliver Amazon Timestream for InfluxDB, a new managed offering for AWS customers to run InfluxDB open source natively within the AWS Management Console.

AWS Partners with InfluxData to Bring InfluxDB Open Source to Developers Around the World

Today, AWS announced Amazon Timestream for InfluxDB, a new managed offering for AWS customers to run single-instance open source InfluxDB natively within the AWS console. This partnership represents a significant multi-year commitment by AWS to combine its global reach and accessibility with our industry-leading time series database, InfluxDB. AWS adding InfluxDB as a preferred time series database reflects the demand from AWS customers for InfluxDB and evidence of the time series market acceleration.

OpenTelemetry Best Practices #2 Agents, Sidecars, Collectors, Coded Instrumentation

For years, we’ve been installing what vendors have referred to as “agents” that reach into our applications and pull out useful telemetry information from them. From monitoring agents, to full-blown APM tools, this has been the standard for many decades. With OpenTelemetry though, the term “agent” isn’t used as much, and in most scenarios means something slightly different.

The Coexistence of Open Source and Proprietary Software: Striking the Balance

Discover how to build a technology infrastructure to get the best of both open source and proprietary software The debate on the cohabitation of open source software (OSS) and proprietary software has persisted as long as both have existed. OSS, designed for unrestricted access and usage, and proprietary software, its opposite, have often been positioned as opponents in the technology arena. However, the reality is far from this either/or dynamic.

How to scale your systems based on CPU utilization

CPU usage is one of the most common metrics used in observability and cloud computing. It’s for a good reason: CPU usage represents the amount of work a system is performing, and if it’s near 100% capacity, adding more work could make the system unstable. The solution is to scale - add more hosts with more CPU capacity, migrate some of your workloads to the new host, and split the traffic between them using a load balancer.

Reduce alert noise, automate incident response and keep coding with AI-driven alerting

Noisy monitors can lead to alert fatigue, which frustrates engineers and hinders innovation. With our patent-pending anomaly detection capabilities built on the power of AI, you can eliminate 60-90% of alerts. A unique differentiator, Sumo Logic’s alerts can also trigger one or more playbooks to drive auto-diagnosis or remediation and accelerate time to recovery for application incidents. Faster issue remediation means engineers can focus more time on development and releasing software.