Operations | Monitoring | ITSM | DevOps | Cloud

Latest News

BIRCH for Anomaly Detection with InfluxDB

In this tutorial, we’ll use the BIRCH (balanced iterative reducing and clustering using hierarchies) algorithm from scikit-learn with the ADTK (Anomaly Detection Tool Kit) package to detect anomalous CPU behavior. We’ll use the InfluxDB 2.0 Python Client to query our data in InfluxDB 2.0 and return it as a Pandas DataFrame. This tutorial assumes that you have InfluxDB and Telegraf installed and configured on your local machine to gather CPU stats.

Launching Desktop Central Cloud: Embrace UEM the SaaS way!

Desktop Central is a holistic unified endpoint management (UEM) solution that offers a dynamic approach to securing and managing user devices, including desktops, laptops, smartphones, and tablets. Already established as a leader in the UEM field, ManageEngine adds another feather to its cap by now offering a cloud-based UEM solution. Desktop Central Cloud gives you 360-degree control over all your network endpoints.

Diagnosing out-of-memory errors on Linux

Out-of-memory (OOM) errors take place when the Linux kernel can’t provide enough memory to run all of its user-space processes, causing at least one process to exit without warning. Without a comprehensive monitoring solution, OOM errors can be tricky to diagnose. In this post, you will learn how to use Datadog to diagnose OOM errors on Linux systems.

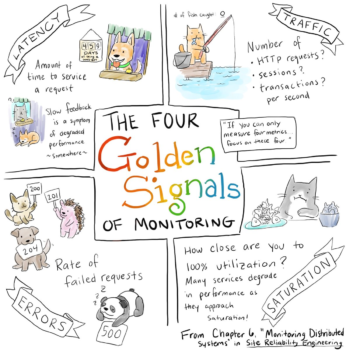
How to monitor Golden signals in Kubernetes

What are Golden signals metrics? How do you monitor golden signals in Kubernetes applications? Golden signals can help to detect issues of a microservices application. These signals are a reduced set of metrics that offer a wide view of a service from a user or consumer perspective, so you can detect potential problems that might be directly affecting the behaviour of the application.

Embed Your Status Page Everywhere

A well-crafted status page is designed to save you time, energy, and resources when communicating service irregularities. Instead of fielding thousands of support requests when you experience an outage, a status page provides a self-service way for your customers to get up-to-the minute information about any current downtime. It also allows you to proactively communicate maintenance and other work in advance.

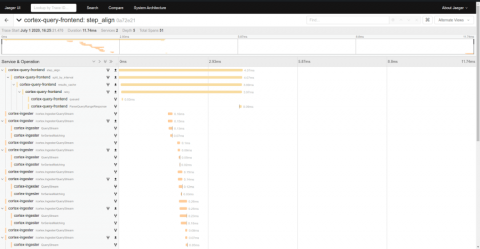
Where did all my spans go? A guide to diagnosing dropped spans in Jaeger distributed tracing

Nothing is more frustrating than feeling like you’ve finally found the perfect trace only to see that you’re missing critical spans. In fact, a common question for new users and operators of Jaeger, the popular distributed tracing system, is: “Where did all my spans go?” In this post we’ll discuss how to diagnose and correct lost spans in each element of the Jaeger span ingestion pipeline.

Monitoring Your Dynamic Cloud Infrastructure

Fully taking advantage of cloud infrastructure includes the ability to scale up and down dynamically, taking the need and load off your services. The compute services like Amazon Web Services (AWS) EC2, Azure Virtual Machines (VM), and Google Cloud Platform (GCP) Compute Engine allow Auto Scaling of the instances of the service. This helps manage the responsiveness and costs of your cloud services by ensuring that the instance counts go up and down depending on demand.