Operations | Monitoring | ITSM | DevOps | Cloud

Latest News

Ivanti Adds New Ivanti Neurons Innovations: Ivanti Neurons for Patch Intelligence and Ivanti Neurons for Spend Intelligence

It's been an exciting week at Ivanti! On Wednesday, we announced enhancements to the Ivanti Neurons platform. We added new Ivanti Neurons innovations (powered by machine learning) to improve security posture and optimize asset spend. Ivanti Neurons for Patch Intelligence helps enable organizations to achieve faster SLAs for their vulnerability remediation efforts via supervised and unsupervised machine learning algorithms.

The Central Role of Application Performance Monitoring in Enterprise IT

After all, when an IT outage occurs, it disrupts the business. Employee productivity is impacted, customers are unable to transact, and the organization’s brand is at stake. Monitoring needs to cover all aspects of IT – from hardware, to storage, to server to the application stack. With the focus on keeping users happy, the importance of monitoring at the application layer has had more attention recently.

Uptime monitoring: A boon for your business

A highly functional IT network is the basis of any successful modern business, and for effective operations, organizations must monitor the health and availability of all their IT infrastructure components and ensure they’re up and running 24×7. Uptime is the duration during which a network component is reachable and capable of operating efficiently. Typical networks use ICMP or TCP to communicate with devices and identify idle or inactive ones.

How to Monitor AWS Kinesis with CloudWatch

If you’re using AWS Kinesis in your application, you’ll want to monitor your Kinesis streams to make sure they are healthy and that your producers and consumers are interacting with them correctly. CloudWatch exposes many metrics that can help you determine the health of your Kinesis streams, but it can be a pain to set up. In this post, we’ll discuss the metrics that are most helpful, how to get CloudWatch up and monitoring your Kinesis streams, plus an easier alternative.

What is Prometheus?

In recent times, Prometheus has become the standard for application monitoring in the tech space. But what exactly is Prometheus? Over the course of this article, we’ll touch on various subtopics to help answer this question, ranging from where it all started, to its architecture and how exactly it does monitoring. We'll address the various possible integrations/tools that can be used alongside Prometheus, and why Prometheus is a great tool for monitoring these platforms and applications.

Monitoring MongoDB Performance

In this article, you’ll learn the basics of MongoDB. We’ll cover its performance metrics, built-in monitoring commands, utilities and tools, and common monitoring strategies. You will also be introduced to a monitoring tool called MetricFire and provided with some examples of how it can be used in production systems together with setup instructions.

The Holy Grail of Cherwell Service Request Automation

Companies are facing major difficulties as a result of the challenges posed by COVID-19, and many professionals cite automation as a key solution to business survival. However, when considering using automation to transform your service management, you need to consider how you leverage Cherwell Service Requests in partnership with automation to achieve the “holy grail” of service request automation.

Introducing the Snowflake Enterprise plugin for Grafana

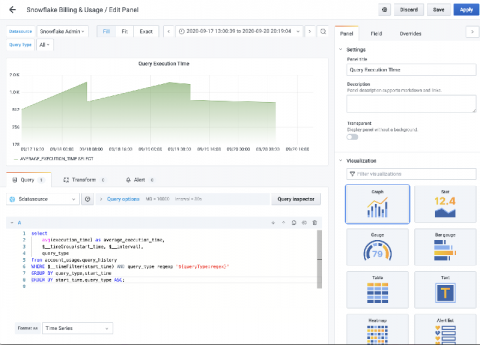
Snowflake offers a cloud-based data storage and analytics service, generally termed “data warehouse-as-a-service.” The main benefit of Snowflake is that you pay for compute and storage that you “actually use,” so it’s not “just another database.” Snowflake has become very popular over the last few years, culminating in a huge IPO just a couple of weeks ago, by allowing enterprise users to affordably store and analyze data using cloud-based hardware and software

Azure Logic Apps Error Handling Using Serverless360 BAM

A few weeks ago, my good friend Josh Cook wrote a blog post for Power Automate about getting the error message when implementing the try/catch pattern with a Flow. We discussed if this could be used with Logic Apps, and Josh confirmed that it could, even though the Logic App documentation doesn’t cover it very well. Josh’s original Flow post is- Grabbing an error message from a failed run.